Business Plan Example: Startup Expenses and Capitalization Budget
Table 1: The startup expenses and capitalization budget for the business
| Expense | Amount |
|---|---|
| Equipment and supplies | $500 |
| Rent | $1,000 |
| Market research | |
| Research tools (stationary, smartphones, laptops, audio recorders, and video recorders) | $500 |
| Legal and regulatory costs | |
| License and permits | $200 |
| Business registration | $200 |
| Legal fees | $300 |
| Marketing | |
| Digital and social media campaigns | $500 |
| Advertising costs | $600 |
| Sales promotions | $300 |
| Administrative costs | $1,000 |
| Staffing costs | |
| Recruiting and selection | $500 |
| Training | $1,000 |
| Salaries, wages and benefits | $2,500 |
| Utility costs | |
| Electricity | $300 |
| Water | $200 |
| Internet | $100 |
| Phone | $100 |
| Miscellaneous expenses | $200 |
| Total Expenses | $10,000 |
- Table 1 shows the expenses the business will incur in its first year or when it will start.
- The highest costs will be on the salaries, wages, and benefits the business will spend to pay its workers. The business must attract qualified staff to manage its operations during the first year. The business will also require personnel to design and manufacture the products. Additional staff will be required for the management of business operations and marketing. With an estimated size of 8-12 employees, the business will have to spend highly on salaries, wages, and benefits.
- Training employees, especially in customer relations and marketing, will require many costs, similar to administrative functions.
- The business will also have to acquire equipment and supplies at $500.
- The business will require a space for storing the products and office. The estimated rent for this year is $1,000. Considering it is a startup focused on penetrating and dominating the market, the business will be required to brand and market its products, hence the need for a marketing budget.
- Any business operates under specific regulations, hence the legal expenses involved. The legal and regulatory costs will include licenses and permits, business registration, and legal fees that may cost $700.
- The business utility costs of $700 will result from charges levied on electricity, water, internet, and phone.
- In total, the business startup costs will be $10,000.
Table 2: Funding source for the business
| Funding source | Amount |
|---|---|
| Owner’s capital | $3,000 |
| Bank loan | $4,600 |
| Funding from an investor | $2,400 |
| Total | $10,000 |
As shown in Table 2, the main source of the business funds will be the owner’s capital ($3,000). The second source of funding will be a bank loan worth $4,600. The last funding source will be an investor fund of $2,400. The following pie chart represents outlook of the sources of funds.
Figure 1: Sources of funds (Pie Chart)
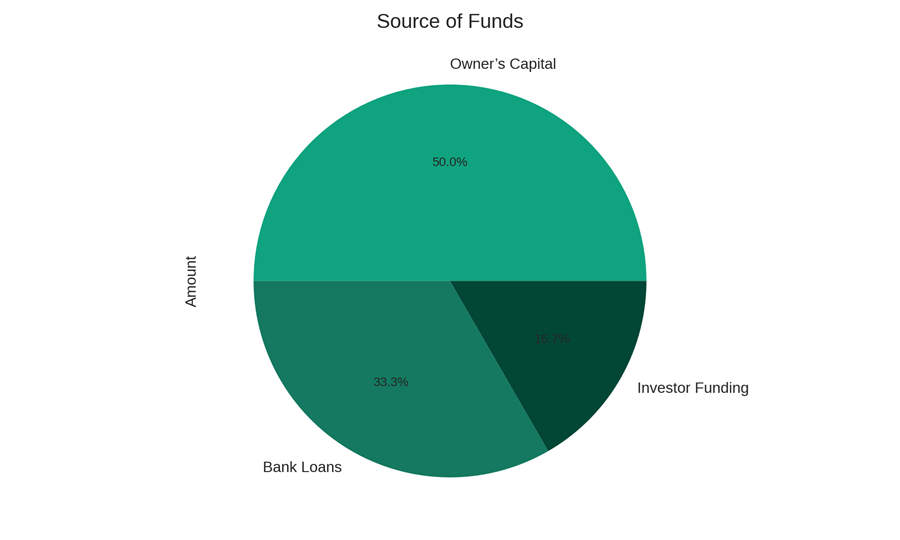
- Owner’s Capital forms the majority of the funding, contributing 50% of the total startup capital.
- Bank Loans account for 33.3%, showing a significant reliance on borrowed capital.
- Investor Funding makes up the remaining 16.7%, indicating a moderate level of external equity funding.
- This mix of funding sources suggests a balanced approach to financing, combining personal investment, debt, and external equity.
Figure 2: Expense based on their total amount
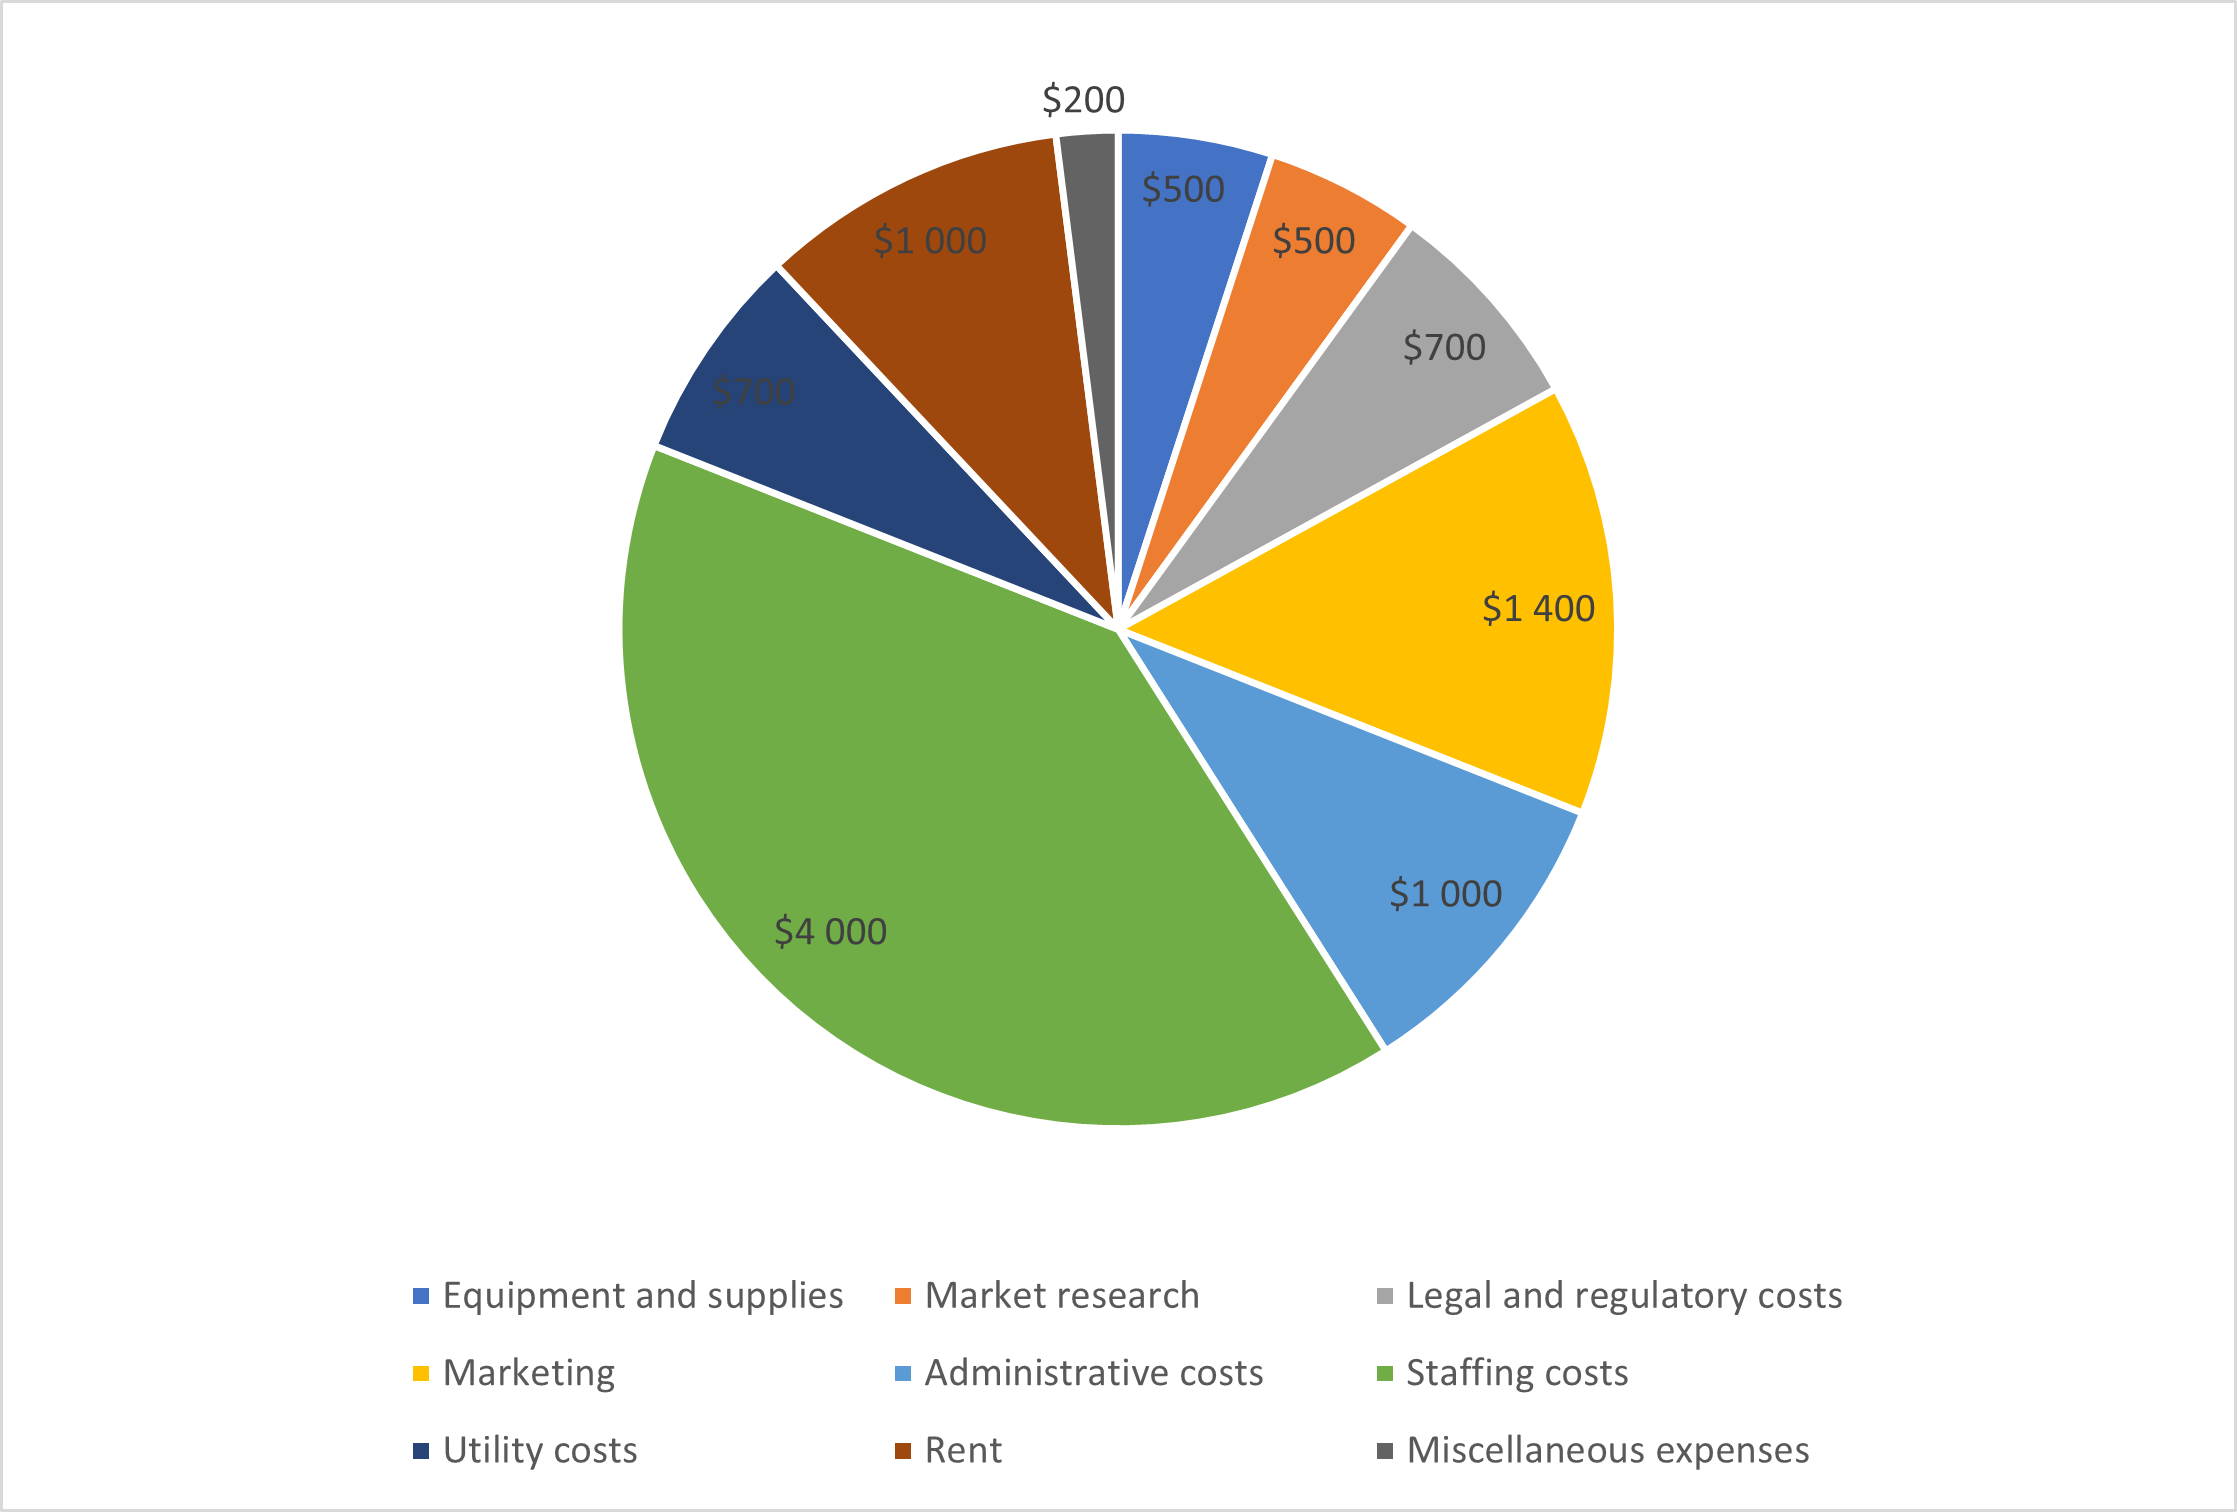
- Figure shows the categories of expenses and their total amount. Staffing costs are the highest expense, $4000, followed by marketing ($1400).
- Administrative costs and rent will each be $1000.
- Total legal and regulatory fees and utility costs will be $700 each.
- Market research equipment and supplies will cost $500 each.
- Miscellaneous expenses will be the lowest ($200).
Figure 3: Percentages of expenses respective to the total startup costs
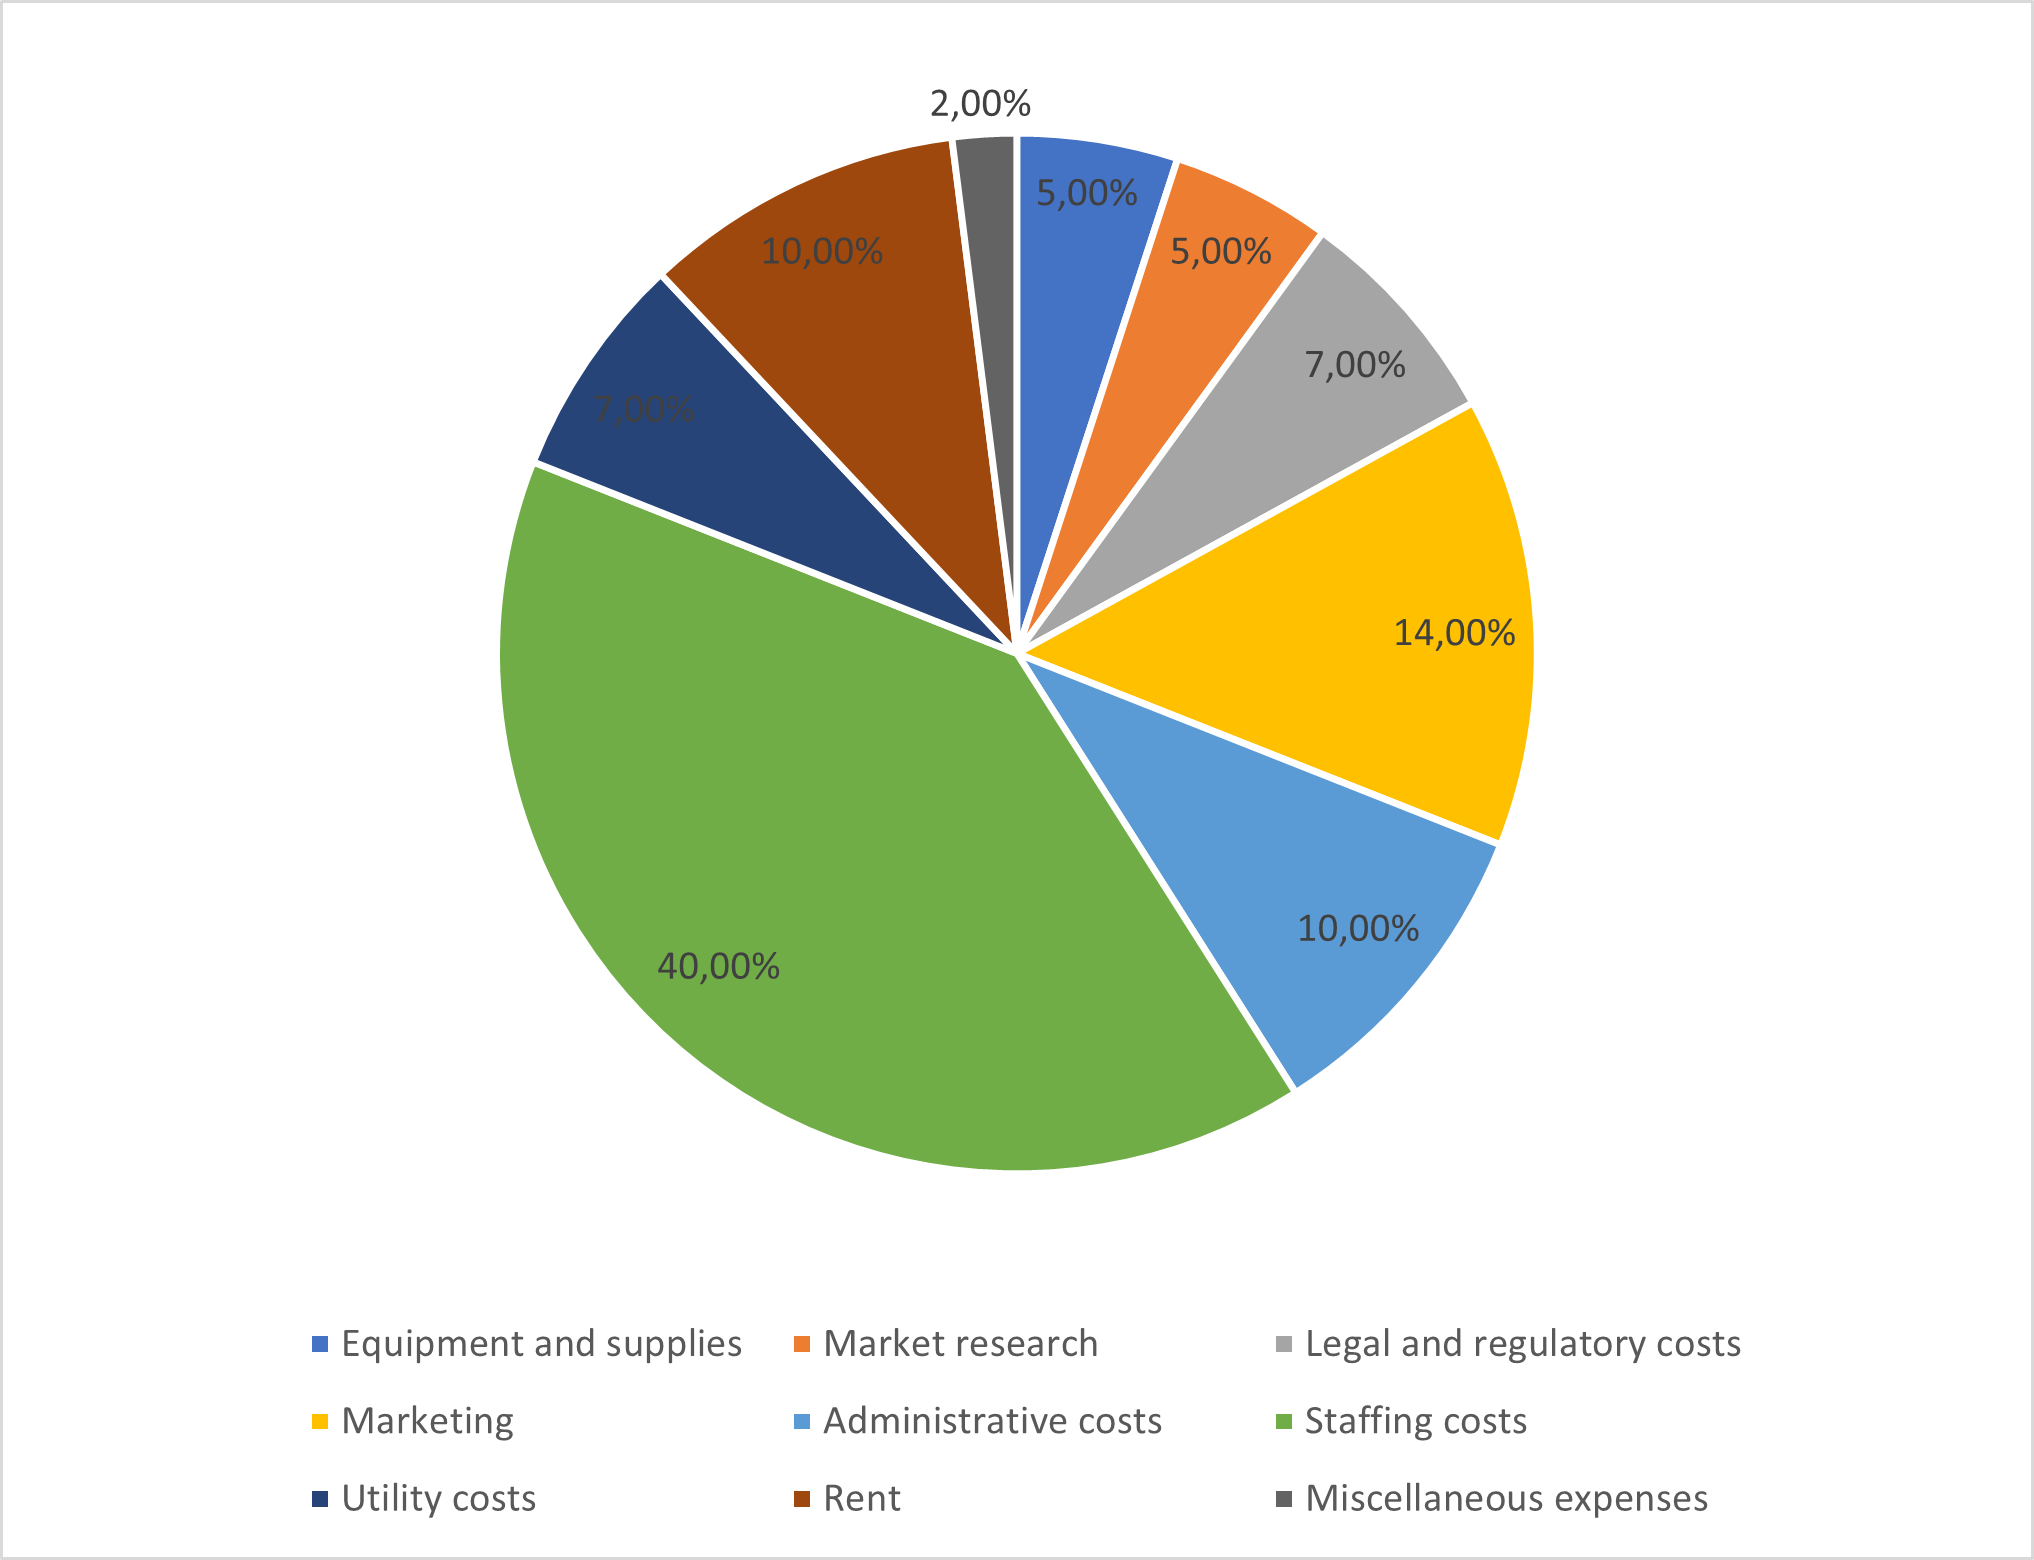
- Figure 2 shows that the largest share of the budget will be staffing costs (40%), followed by marketing (14%).
- Administrative costs and rent will have an equal share of 10%.
- Total legal and regulatory fees and utility costs will also have an equal share of 7%.
- Market research and equipment and supplies will have an equal share of 5%.
- Miscellaneous expenses will take only 2% of the total budget.
Financial Plan
Table 3: The business financial plan (expenses, revenues, and profits) for five years,
| Year 1 | Year 2 | Year 3 | Year 4 | Year 5 | |
|---|---|---|---|---|---|
| Revenues | $20,000 | $25,000 | $30,000 | $35,000 | $40,000 |
| Expenses | |||||
| Equipment and supplies | $500 | $500 | $500 | $500 | $500 |
| Rent | $1,000 | $1,000 | $1,000 | $1,000 | $1,000 |
| Market research | |||||
| Research tools (stationary, smartphones, laptops, audio recorders, and video recorders) | $500 | $0 | $0 | $0 | $0 |
| Legal and regulatory costs | |||||
| License and permits | $200 | $200 | $200 | $200 | $200 |
| Business registration | $200 | $200 | $200 | $200 | $200 |
| Legal fees | $300 | $300 | $300 | $300 | $300 |
| Marketing | |||||
| Digital and social media campaigns | $0 | $500 | $500 | $500 | $500 |
| Advertising costs | $600 | $600 | $600 | $600 | $600 |
| Sales promotions | $300 | $300 | $300 | $300 | $300 |
| Administrative costs | $1,000 | $1,000 | $1,000 | $1,000 | $1,000 |
| Staffing costs | 0 | ||||
| Recruiting and selection | $500 | $500 | $500 | $1,000 | $1,000 |
| Training | $1,000 | $1,000 | $0 | $0 | $1,000 |
| Salaries, wages and benefits | $2,500 | $2,500 | $2,500 | $2,500 | $2,500 |
| Utility costs | $0 | ||||
| Electricity | $300 | $300 | $300 | $300 | $300 |
| Water | $200 | $200 | $200 | $200 | $200 |
| Internet | $100 | $100 | $100 | $100 | $100 |
| Phone | $100 | $100 | $100 | $100 | $100 |
| Miscellaneous expenses | $200 | $200 | $200 | $200 | $200 |
| Total Expenses | $10,000 | $9,500 | $8,500 | $9,000 | $10,000 |
| Profits | |||||
| $10,000 | $15,500 | $21,500 | $26,000 | $30,000 |
- The financial plan shows the business’s projected expenses, revenues, and profits for five years. In the first year, the business expenses and revenues will be $10,000 and $20,000, respectively, which will lead to a profit of $10,000.
- In its second year, the business will earn a profit of $15,500 after deducting $9,500 in expenses from a revenue of $25,000.
- In the third year, the business will earn a revenue of $30,000, a deduction of $8,500, as its expenses will leave a profit of $21,500.
- Then, in the fourth year, the business’s revenues and expenses will amount to $35,000 and $9,000, respectively, leading to a profit of $26,000.
- Finally, during the fifth year, the business projected revenues will amount to $40,000 while the expenses will be $10,000, leading to a profit of $30,000.
Figure 4: Gross Margin Monthly
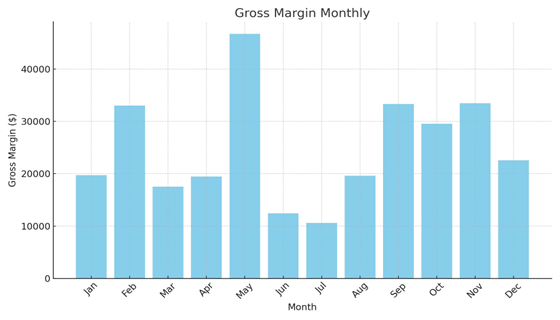
Figure 5. Monthly Cash Flow Projection for the First Year
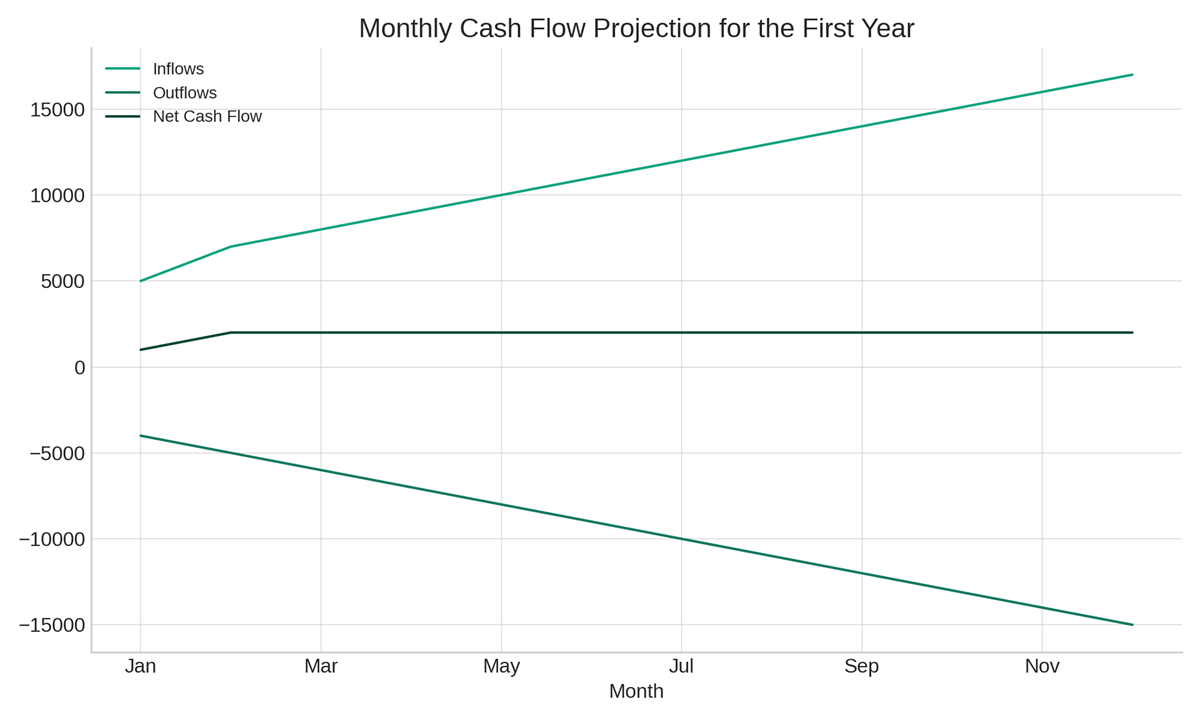
- The graph shows a consistent increase in both cash inflows and outflows over the year, indicating growth in business activities.
- The net cash flow remains positive throughout the year, starting from $1,000 in January and reaching $2,000 by December.
- The increasing gap between inflows and outflows suggests an improving financial health and effective cash management.
- The highest inflow is projected for December ($17,000), while the highest outflow is also in December ($15,000), reflecting a scaling up of operations.
Figure 6: Breakeven Analysis
The chart below shows the point at which total costs and total revenue are equal, indicating the moment when your business starts to generate profit. It can be represented as a line graph with cost and revenue lines, highlighting the breakeven point.
- the green line illustrates the monthly revenue trajectory, beginning at $5,000 and ascending to $20,000 across 12 months.
- Represented by the red line are the monthly costs, a sum of fixed costs at $8,000 and variable costs escalating from $2,000 to $10,000 by year-end.
- The blue dashed line indicates the breakeven point, where revenue equals costs, marked by the intersection of the revenue and cost lines at a specific month.
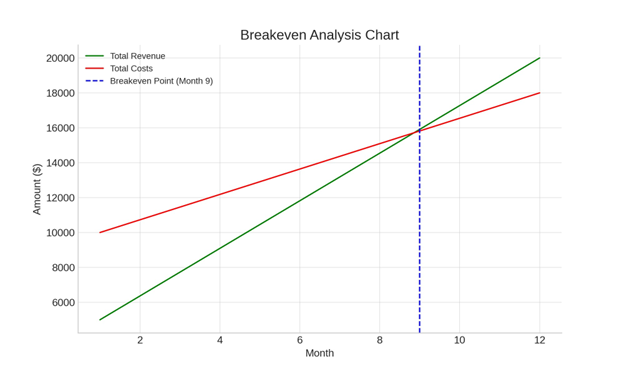
Figure 7: Current Ration Analysis
The current assets divided by current liabilities) for each year, a key metric indicating the liquidity of the business and its ability to cover short-term obligations.
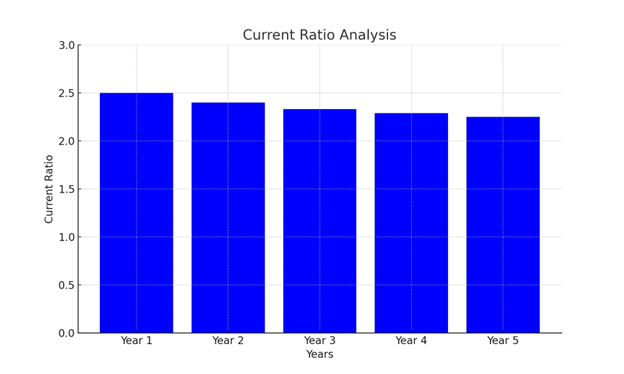
- In year 1, the current ratio at approximately 2.5, indicating the business possesses 2.5 times more current assets than liabilities, reflecting a strong liquidity position for meeting short-term obligations.
- In year 2, Slight decrease in the current ratio to approximately 2.4, potentially due to increased liabilities or slower asset growth, yet the business maintains a healthy stance for addressing short-term debts.
- In year 3, further decline in the current ratio to around 2.33, suggesting an increased dependency on short-term liabilities or a slowdown in asset liquidation; however, the ratio remains above the generally accepted healthy threshold of 2.
- The ratio stands at approximately 2.29 in year 5, which indicates that the gradual decrease over the years remains a point of observation but does not raise immediate concerns as the business maintains more than double the current assets compared to its current liabilities.
Table 5: Projected Expenses, Revenues and Profits
| Year | Revenue ($) | Expenses ($) | Profit ($) |
|---|---|---|---|
| Year 1 | 20,000 | 10,000 | 10,000 |
| Year 2 | 25,000 | 9,500 | 15,500 |
| Year 3 | 30,000 | 8,500 | 21,500 |
| Year 4 | 35,000 | 9,000 | 26,000 |
| Year 5 | 40,000 | 10,000 | 30,000 |
Figure 8: Comparison of business revenues and expenses for five years
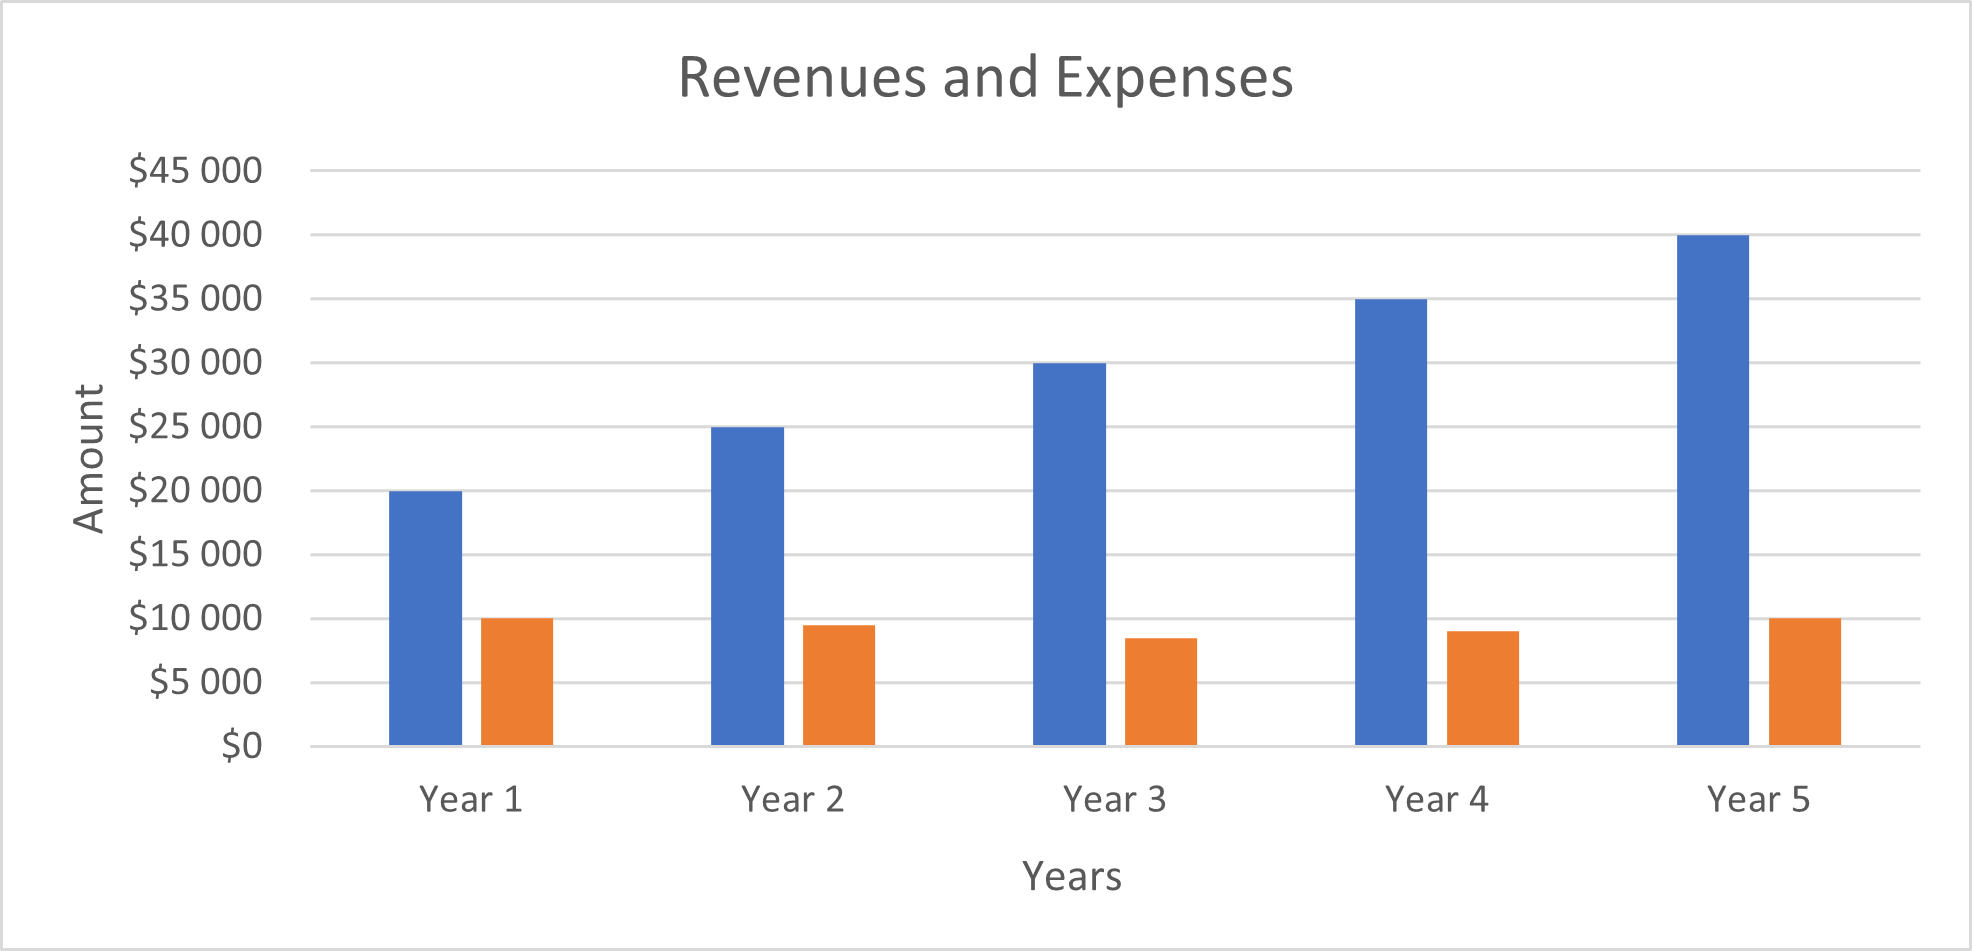
- Figure 3 shows the business expenses and revenues for five years. The revenues will be higher for all the years than expenses, indicating the business will earn profits.
- The business will incur increased operational costs each year as its production increases.
- The highest expenses will be in the fifth year, assuming the business will have increased its operations and hired more workers.
Figure 9: Comparison of projected annual profits for five years
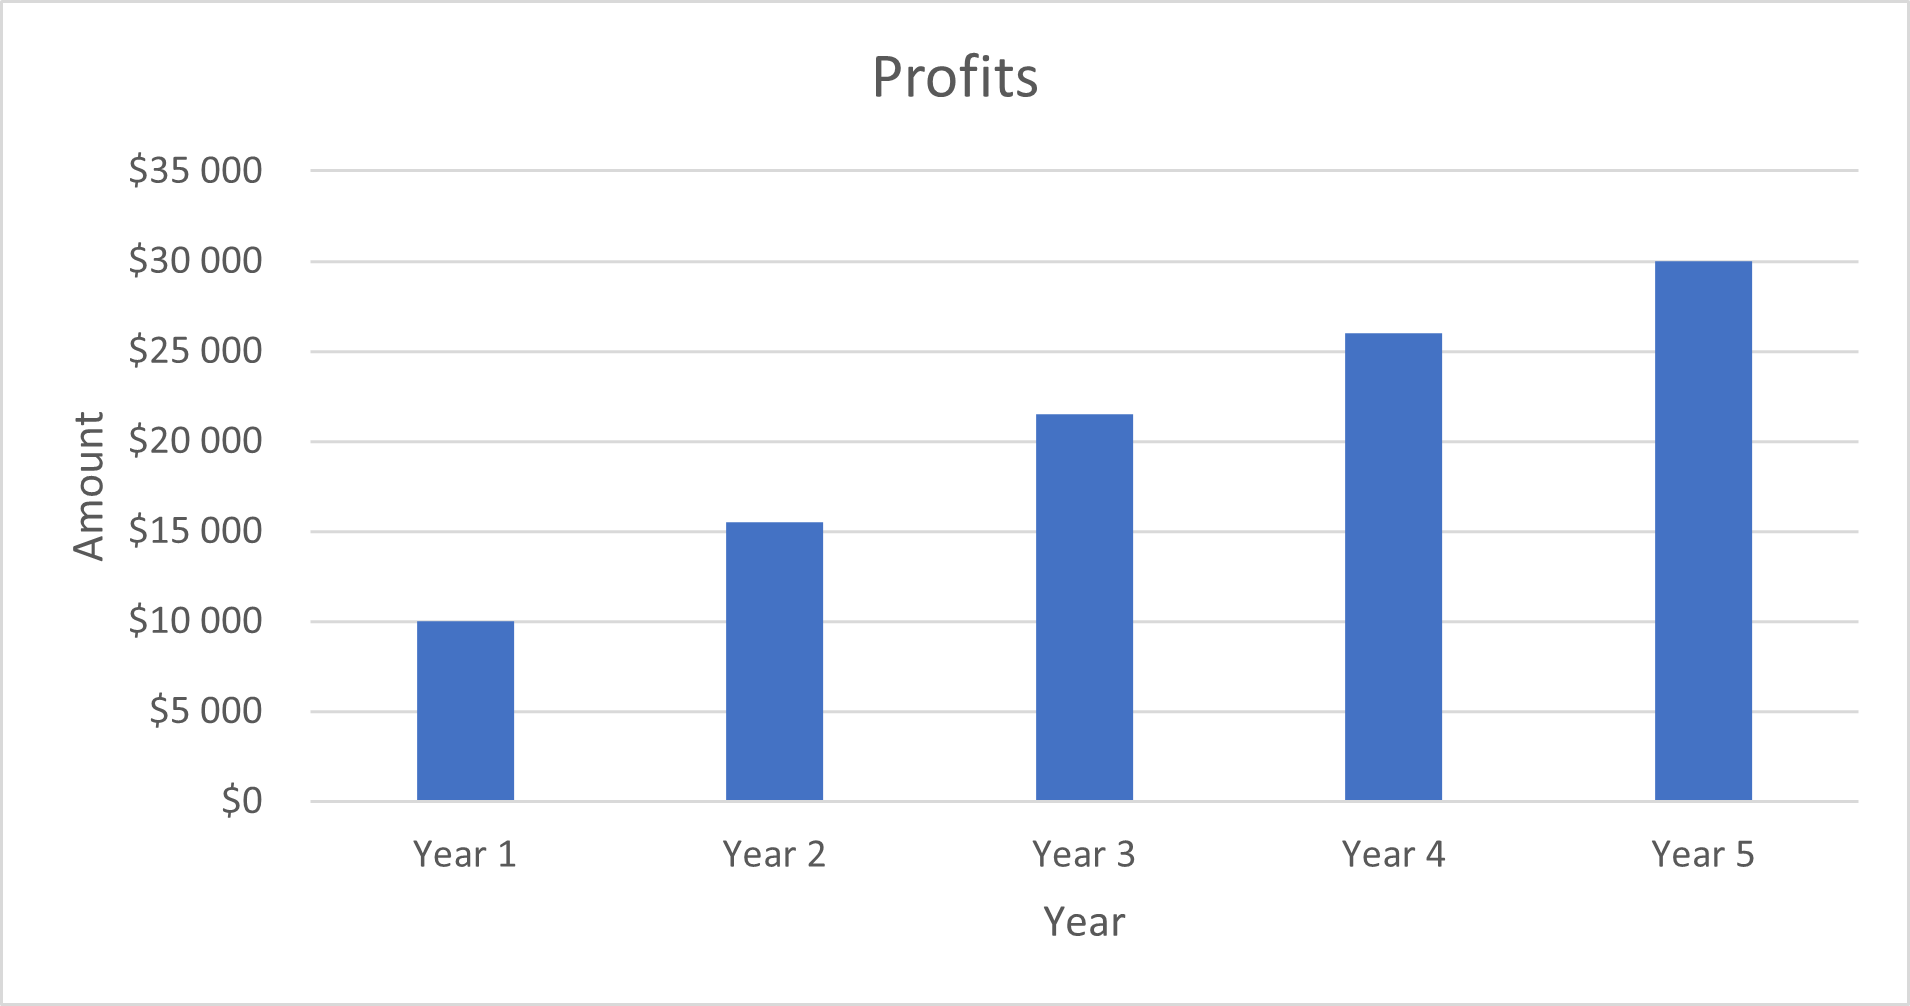
- As shown in Figure 4, the business will have annual positive growth in its profits.
- In its first year, the business will have a low brand awareness, leading to low sales and low profits.
- The highest profits will be realized in the fifth year ($30,000) due to increased sales due to enhanced brand awareness and a growth in market share.
Figure 10: Comparison of the annual growth rate of business revenues for years 2,3,4 and 5
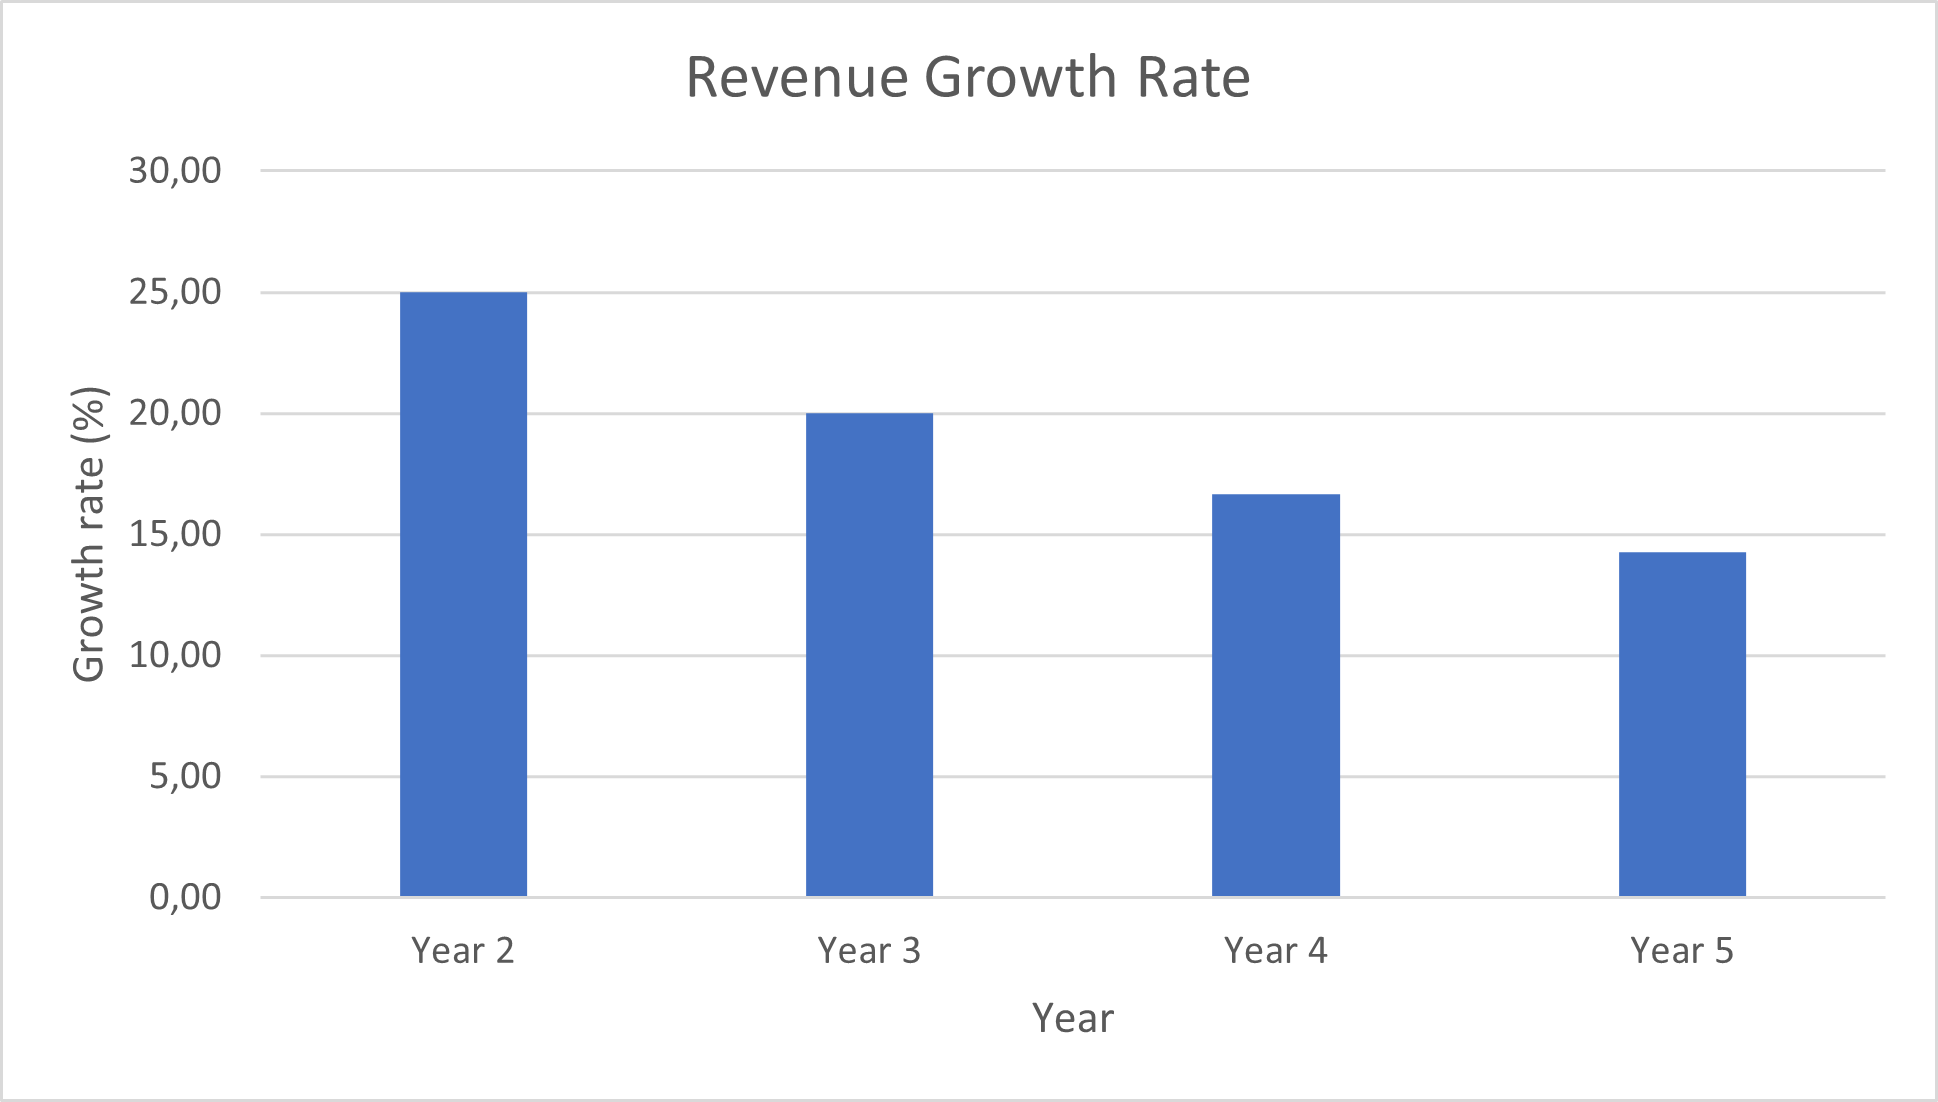
- Figure 5 shows the annual revenue growth rate. After one year, the business revenues will increase by 25%.
- The revenues will grow by 20% between the second and third years.
- However, the revenue growth rate will slow in the fourth and fifth years, 16.67% and 14.29%, respectively, due to increased expenses on employee recruitment and operational costs.
Figure 11: Five-ear revenue forecast
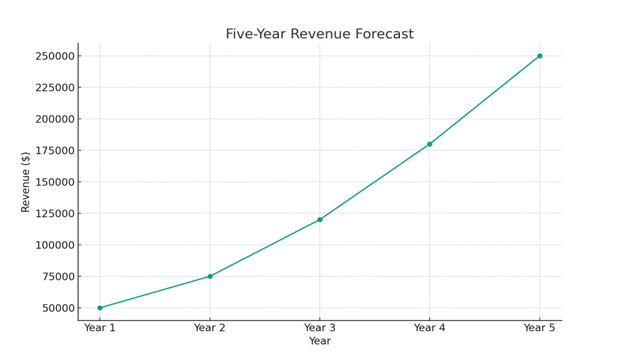
- The graph illustrates a robust and consistent upward trajectory in total revenue over the next five years. Starting from $50,000 in 2023, the revenue is projected to increase annually at a rate of 20%, demonstrating strong growth potential.
- By 2024, the revenue is expected to reach approximately $60,000, followed by a further rise to around $72,000 in 2025. This steady increase signifies the business’s expanding operations and market reach.
- In 2026, the revenue is forecasted to climb to about $86,400, and by 2027, it is anticipated to surge to nearly $103,680. These figures suggest not only a successful business model but also an effective strategy in capturing and growing market share.
- The continuous rise in revenue, without any year-to-year decline, points to a well-planned business strategy and a potentially lucrative market, which reflects the business’s ability to maintain and enhance its revenue streams effectively.
Figure 12: Year-over-year Growth Comparison
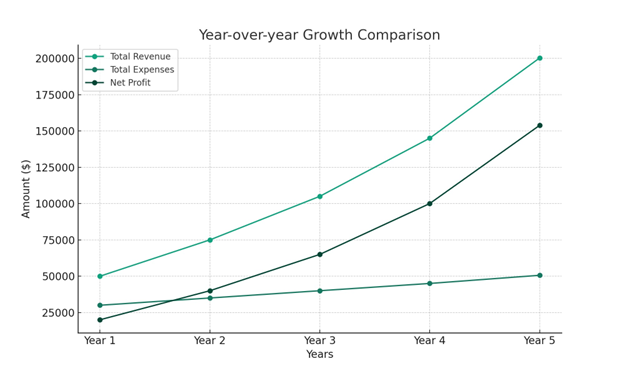
- The graph indicates a steady increase in total revenue, expenses, and net profit over four years.
- Total revenue shows a promising growth trajectory, increasing from $50,000 in year 1 to $110,000 in year 5.
- Total expenses also rise each year, but at a slightly slower rate than revenue, indicating improved efficiency or cost control.
- Net profit consistently increases, starting at $20,000 in year 1 and reaching $65,000 in year 5, reflecting the business’s growing profitability.
Figure 13: Percentage change in business expenses
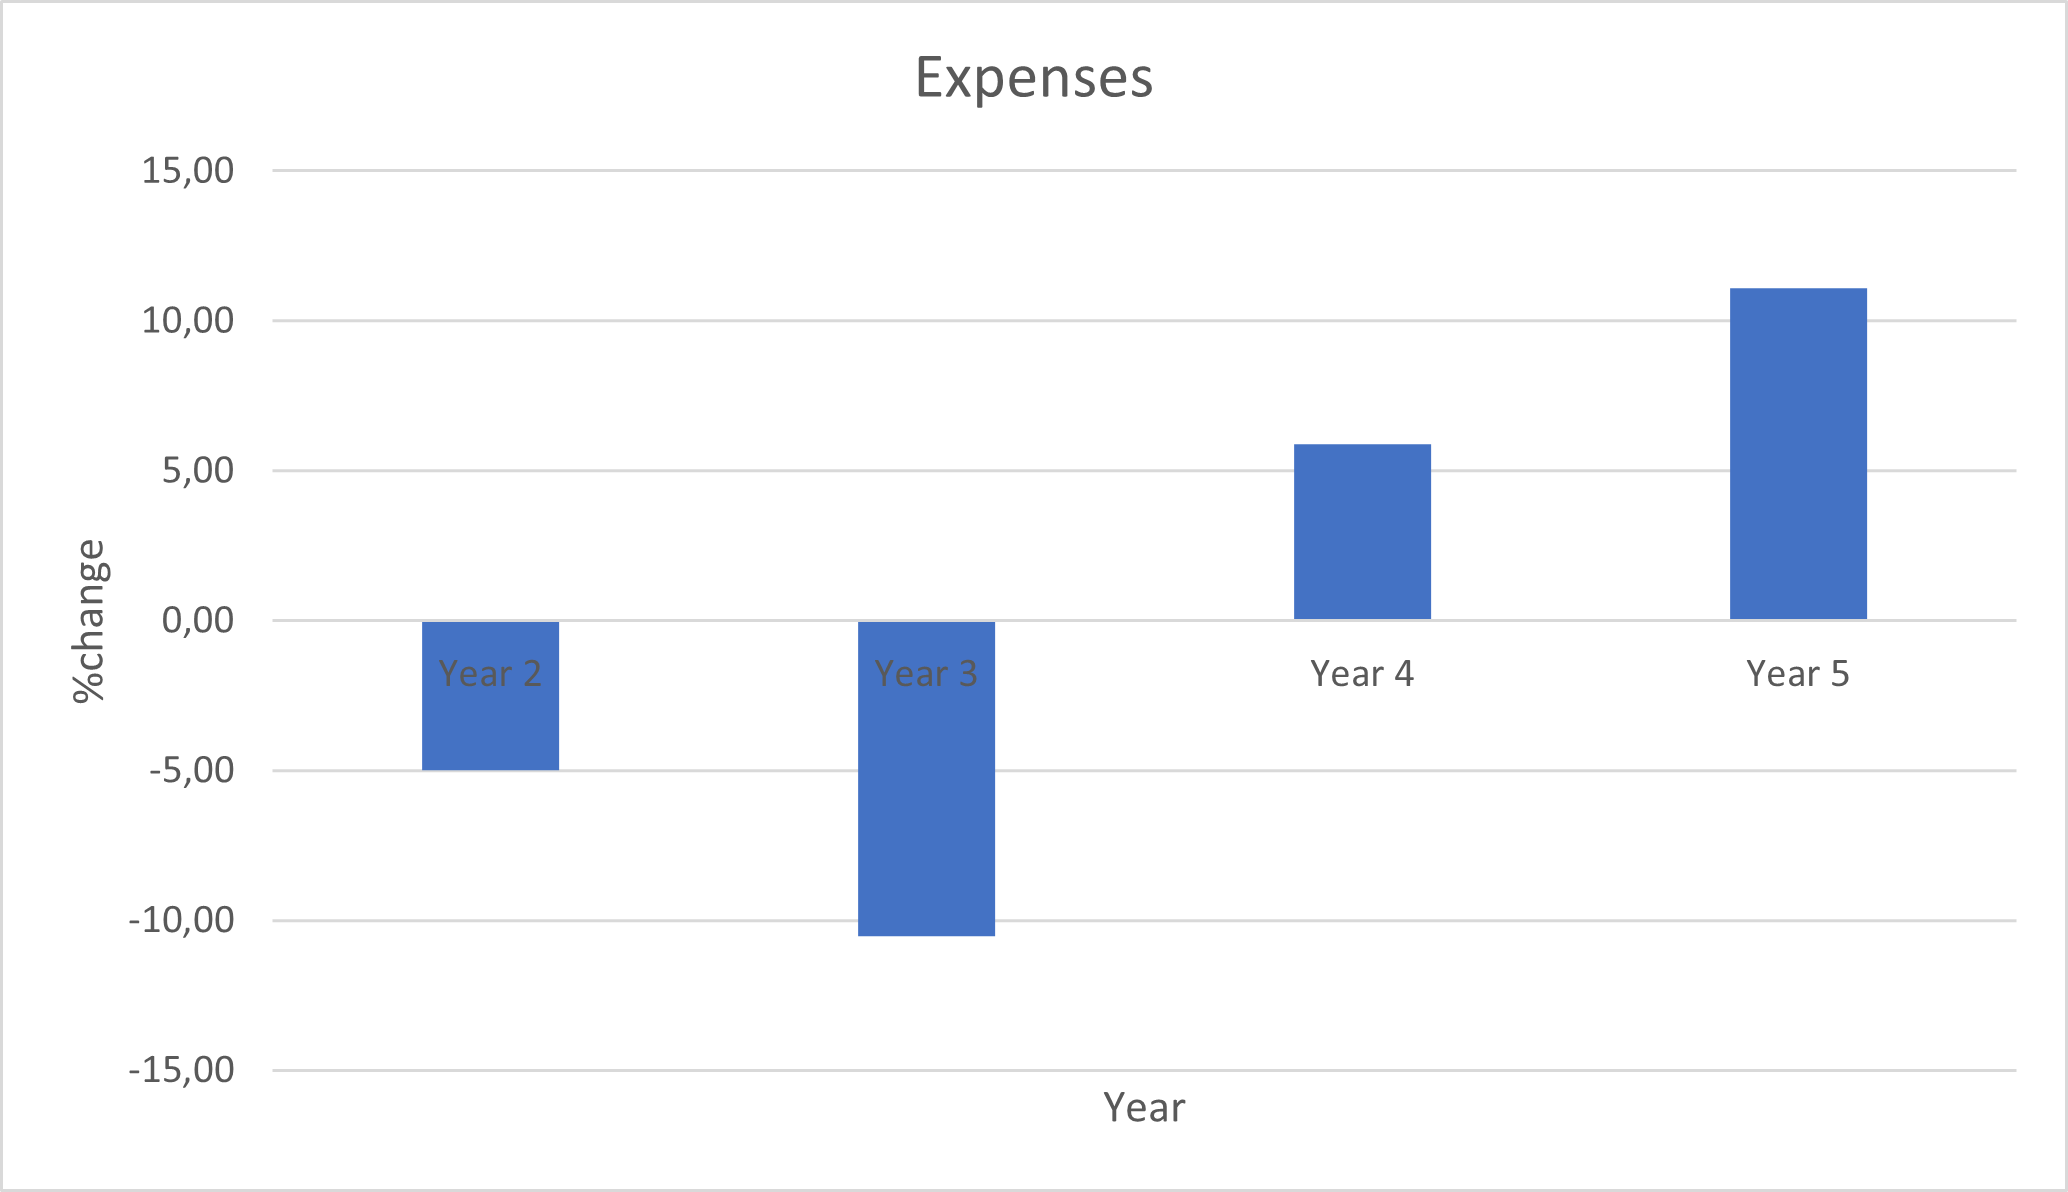
- Figure 6 shows that business expenses will decline sharply in the second year and third years by 5% and 10.53%. This reduction will result from low expenditure on equipment, market research, and staffing.
- However, as the business operations increase, the expenses will rise by 5.88% in the fourth year and 11.11% in the fifth year. The business will hire and train new employees in its fourth year, increasing expenses.
Figure 14: The annual percentage growth of profits
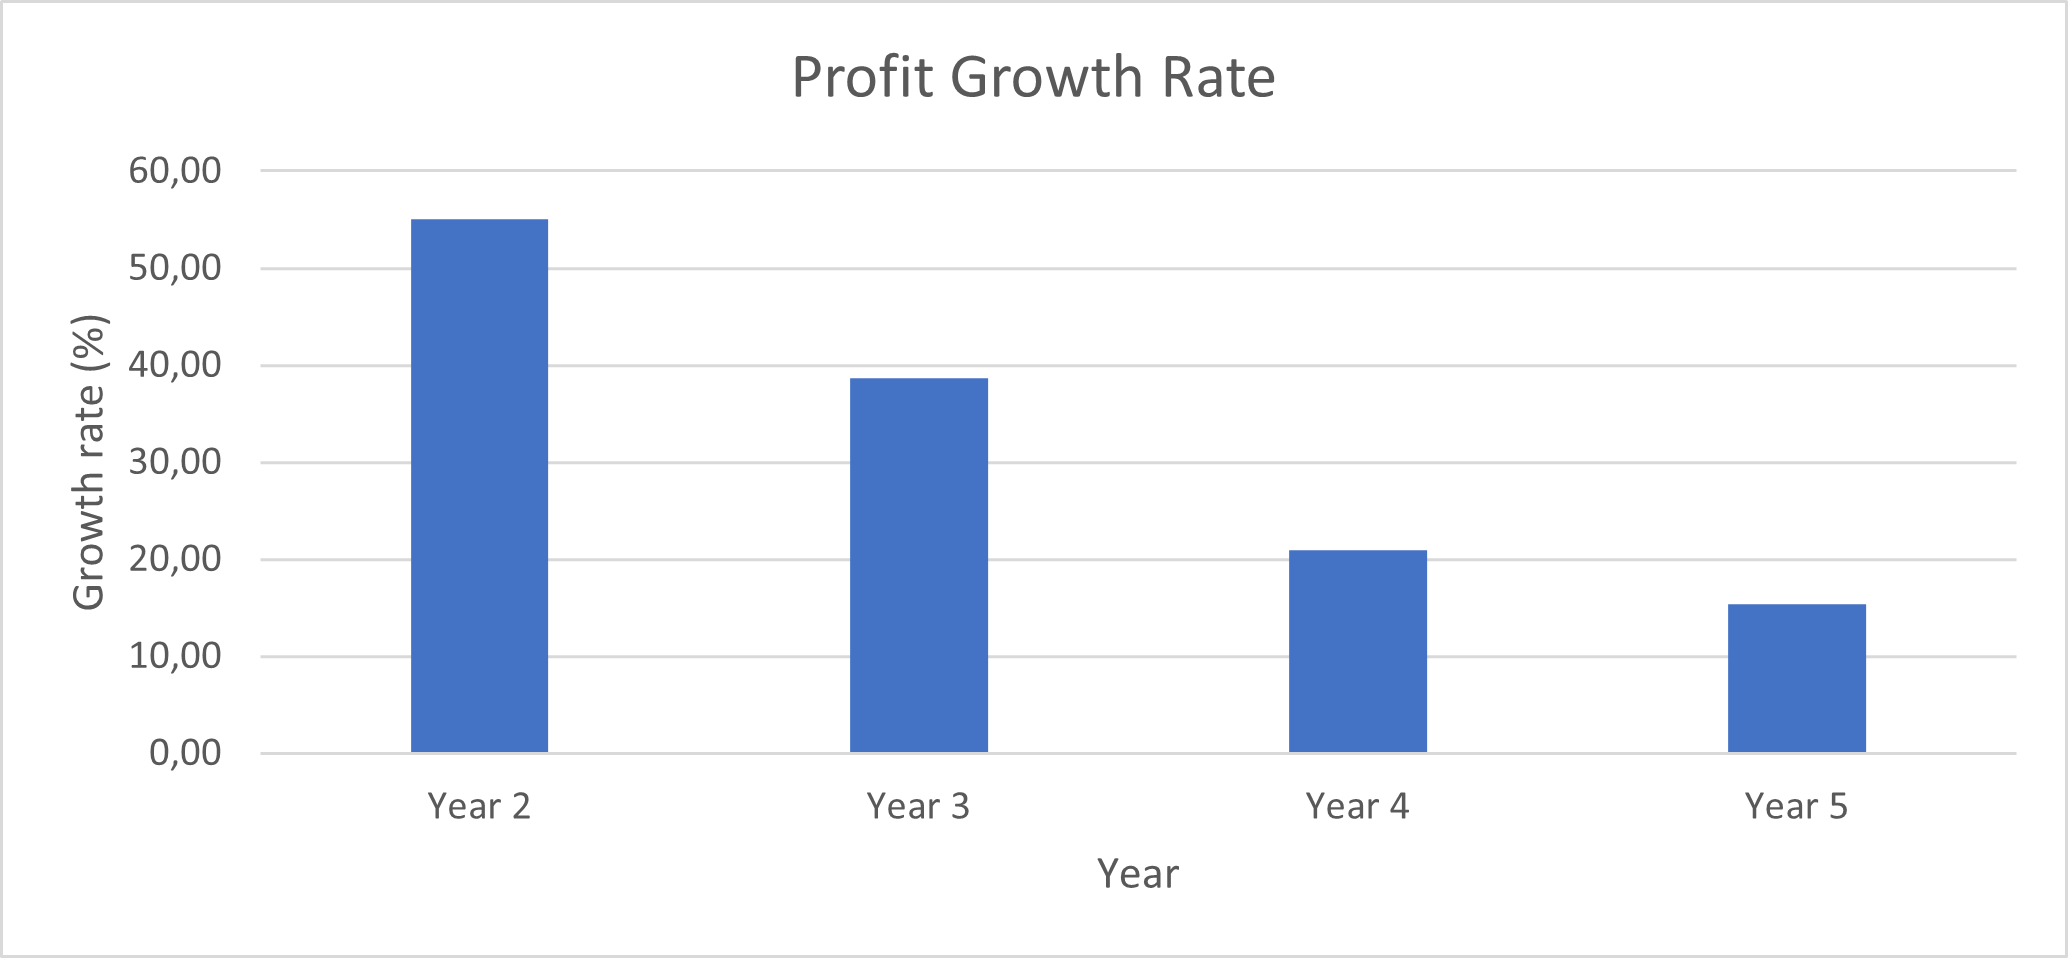
- The business will have the highest profit increase during its second year by 55%.
- Due to increased expenditure on operations, the profits in years 3,4 and 4 will only grow by 38.71%, -20.93%, and 15.38%.
Figure 15: Comparison of annual percentage change in the business expenses and revenues
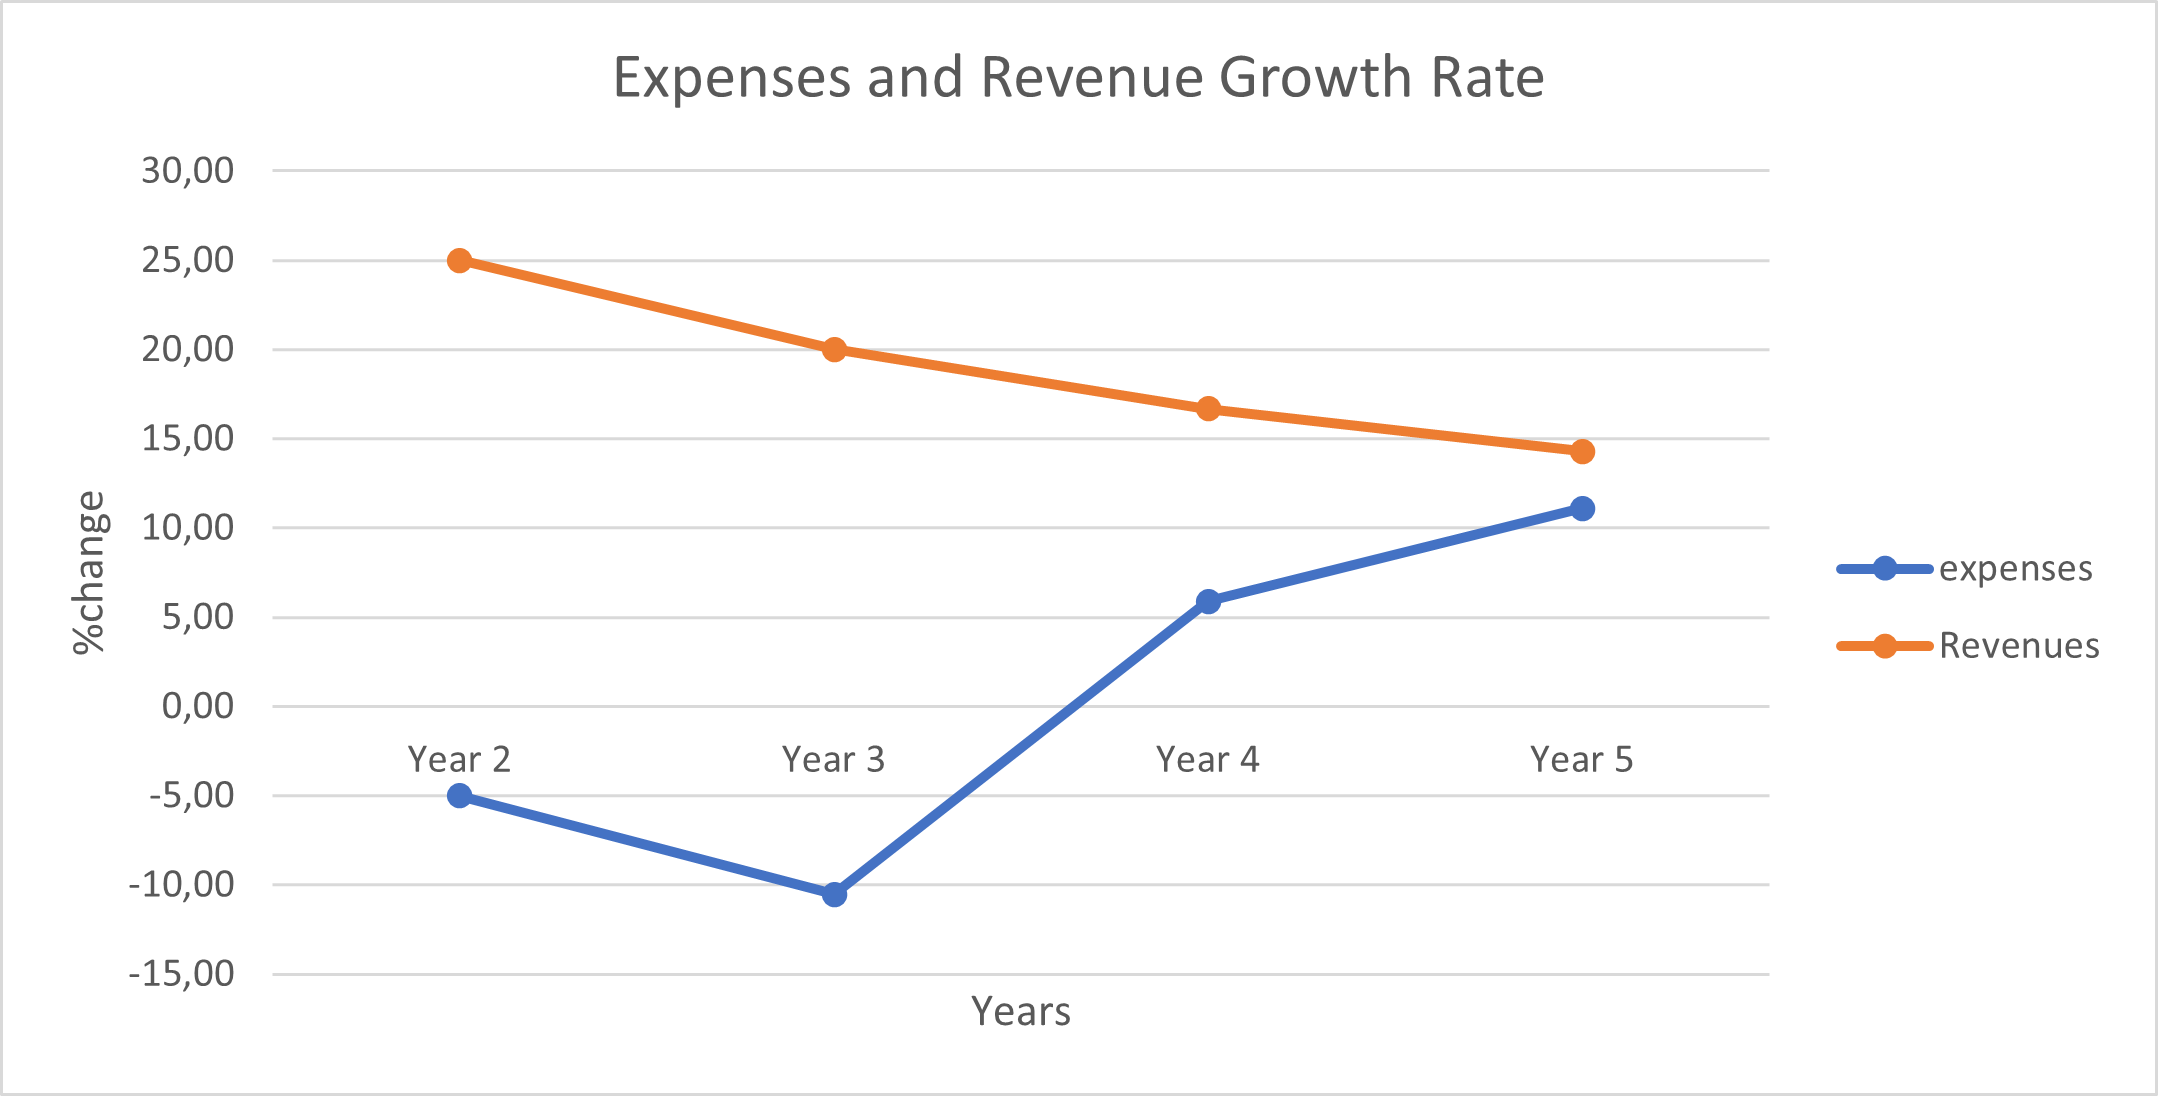
- The business revenues will sharply decline between the second and fourth years due to increased operational costs.
- The expenses on operations will drop between the second and third years, then rise at a slow rate between the fourth and fifth years.
Figure 16: Annual percentage change in the expenses and profits
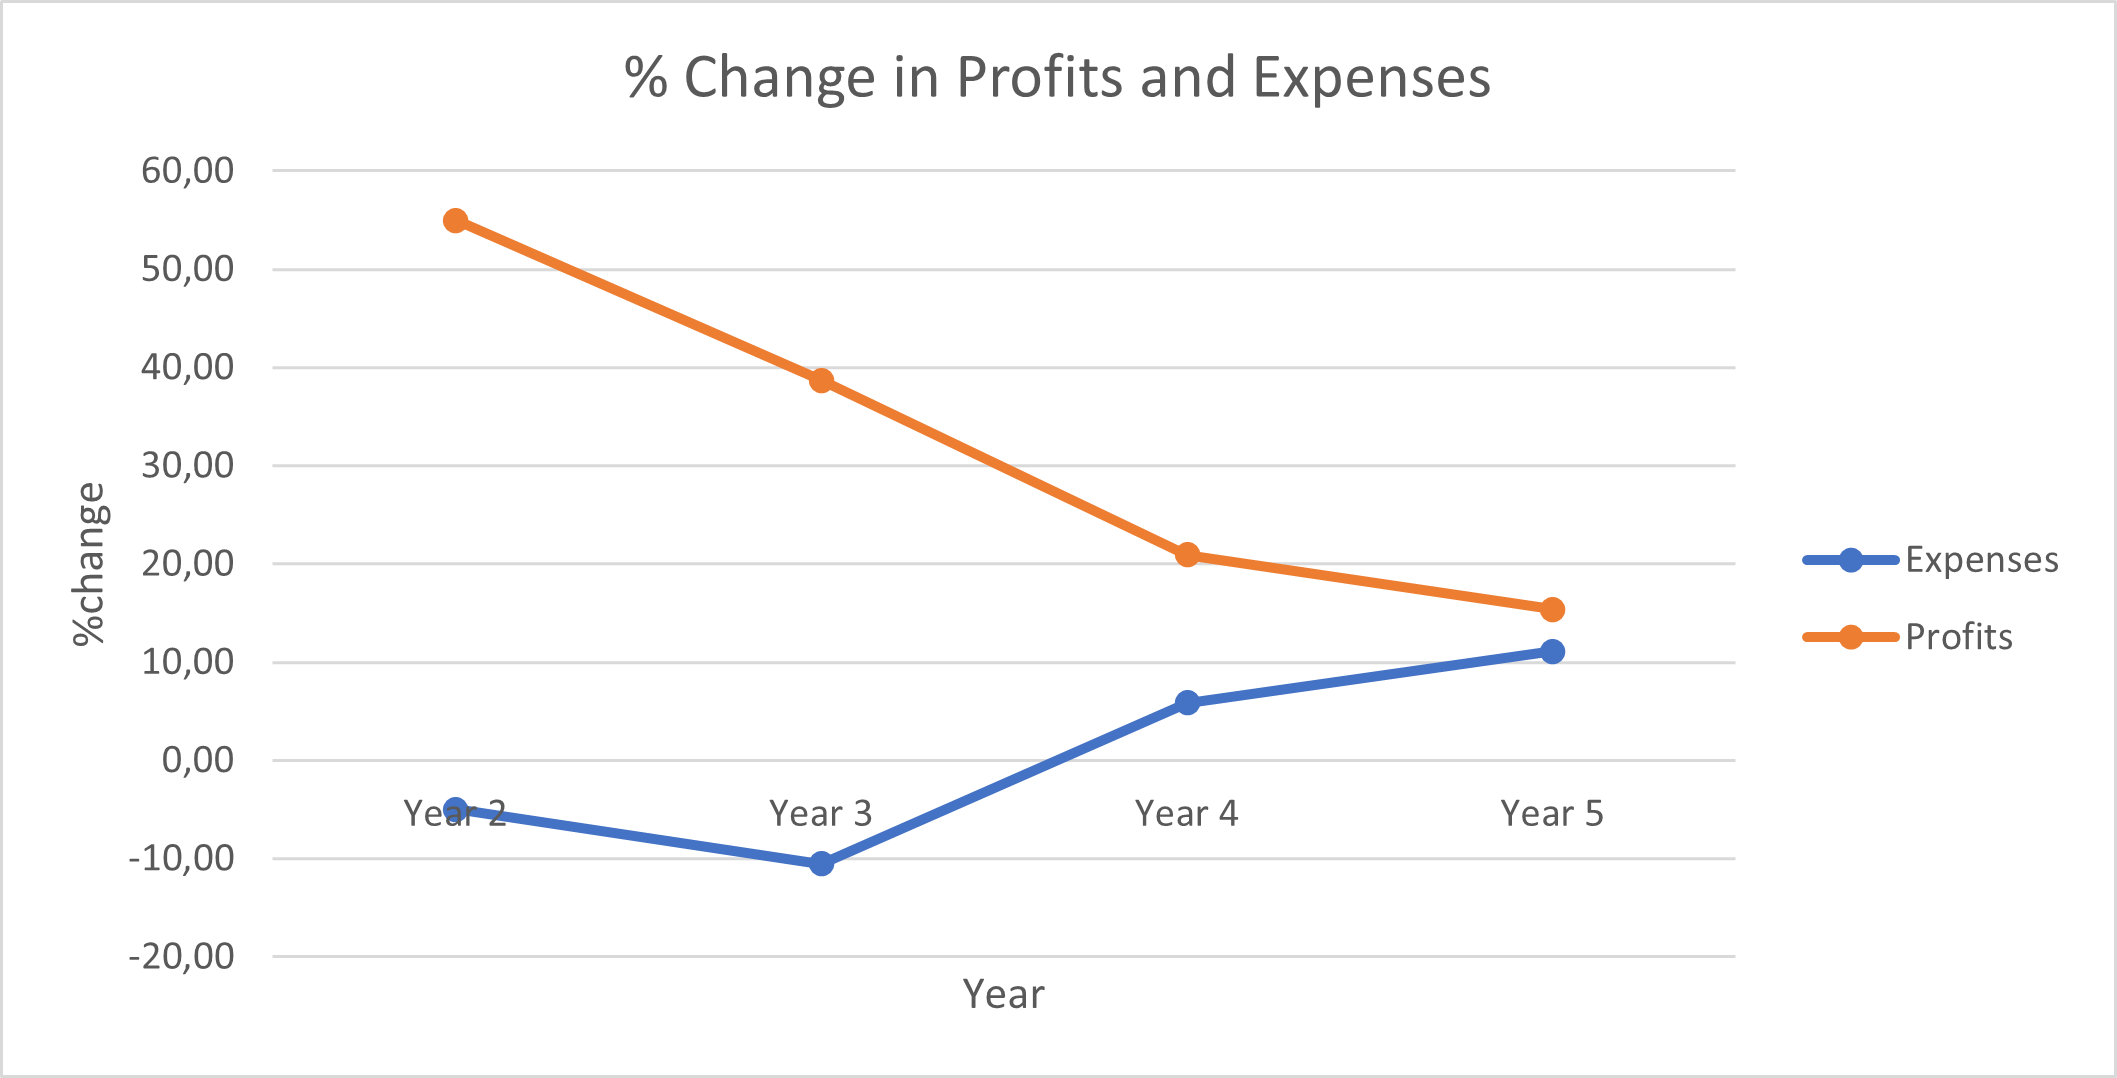
- The business will record a lower percentage change in its annual profits between the second and fourth years. By comparison, the percentage change in expenses will increase during the same period.
- The percentage change in profits and expenses will stagnate in the fourth and fifth years.
Figure 17: Revenue from online sales
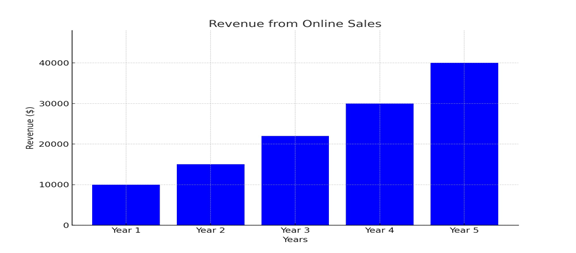
Figure 18: Revenue for Offline Sales
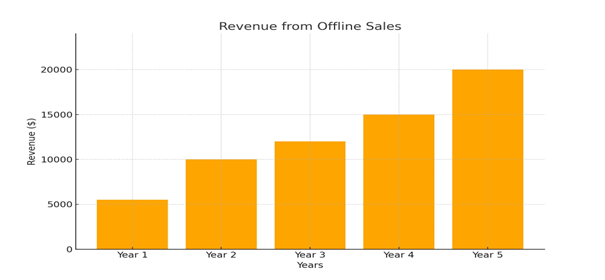
Figure 19: Comparison of Revenues from Online and Offline Sales
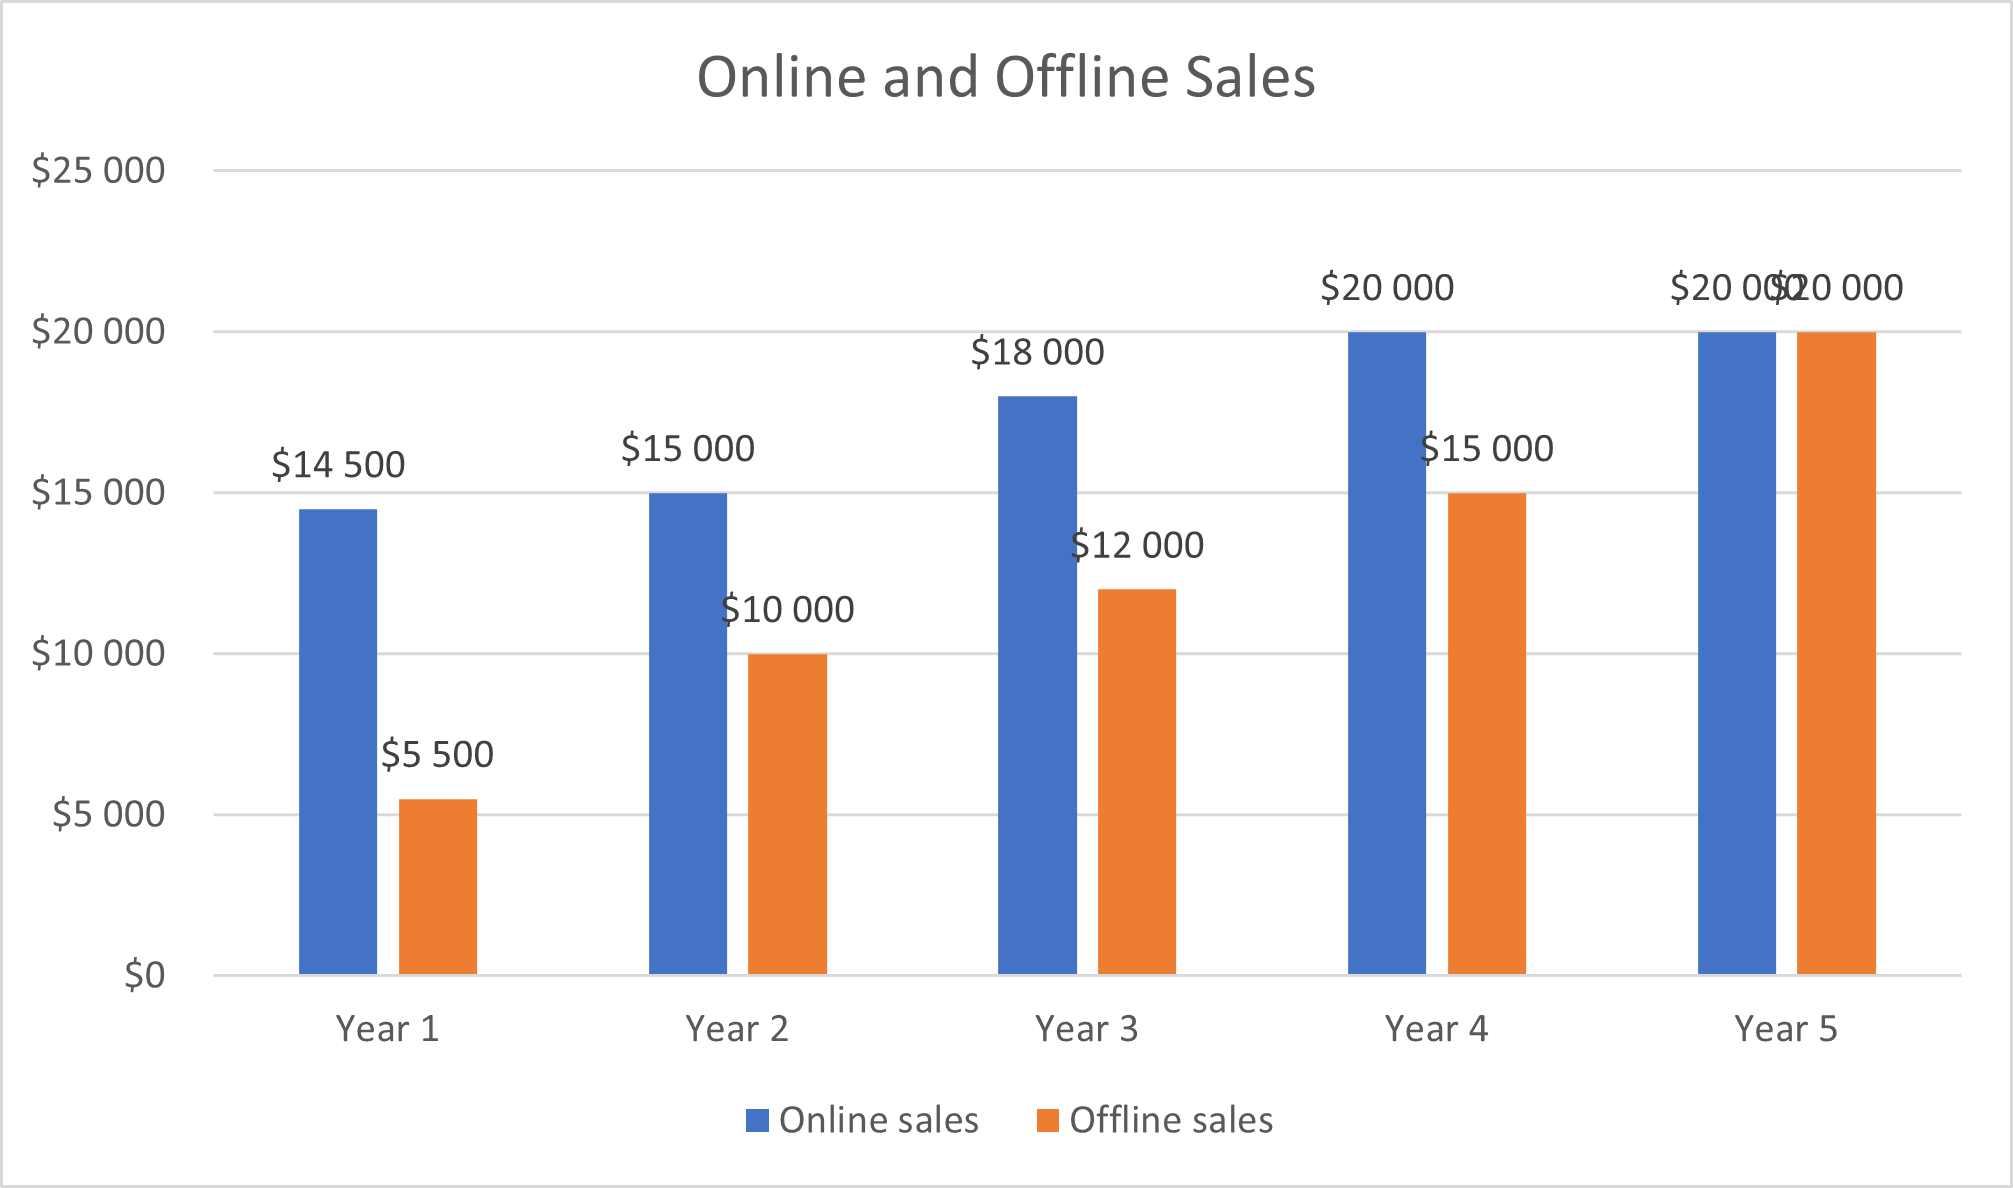
- During its first year, the business will have higher offline sales than online sales. In the second, third, and fourth years, the business offline sales will maintain higher revenues than offline sales. However, offline sales will be increasing steadily each year.
- In its 5th year, the business’s offline sales will equal the online sales.
- The business model entails selling the product to both offline and online customers. Due to the logistics involved in online sales, the rate of revenue generation will be low. However, the business will strive to use methods such as social media marketing to attract more customers as it grows. The projection is that the number of online customers will equal offline customers at the end of the fifth year.
Conclusion
The financial plan shows that the business is profitable. In its first year, the business will incur high expenses. Intensified marketing will enable the business to generate high profits in its second year.
The business will remain profitable in its third, fourth, and fifth years. However, a rise in operational costs will increase expenses and reduce annual profit growth.
