Analytical Essay on Market Share Analysis
Market Share is an essential element from an organization’s viewpoint, especially those that are entering a new market. As evaluated earlier, INNISKILLIN Ice-wine is entering the Brazilian Market. Therefore, the company is looking forward to expanding its market share. The market share for the company for the next five years is as follows;
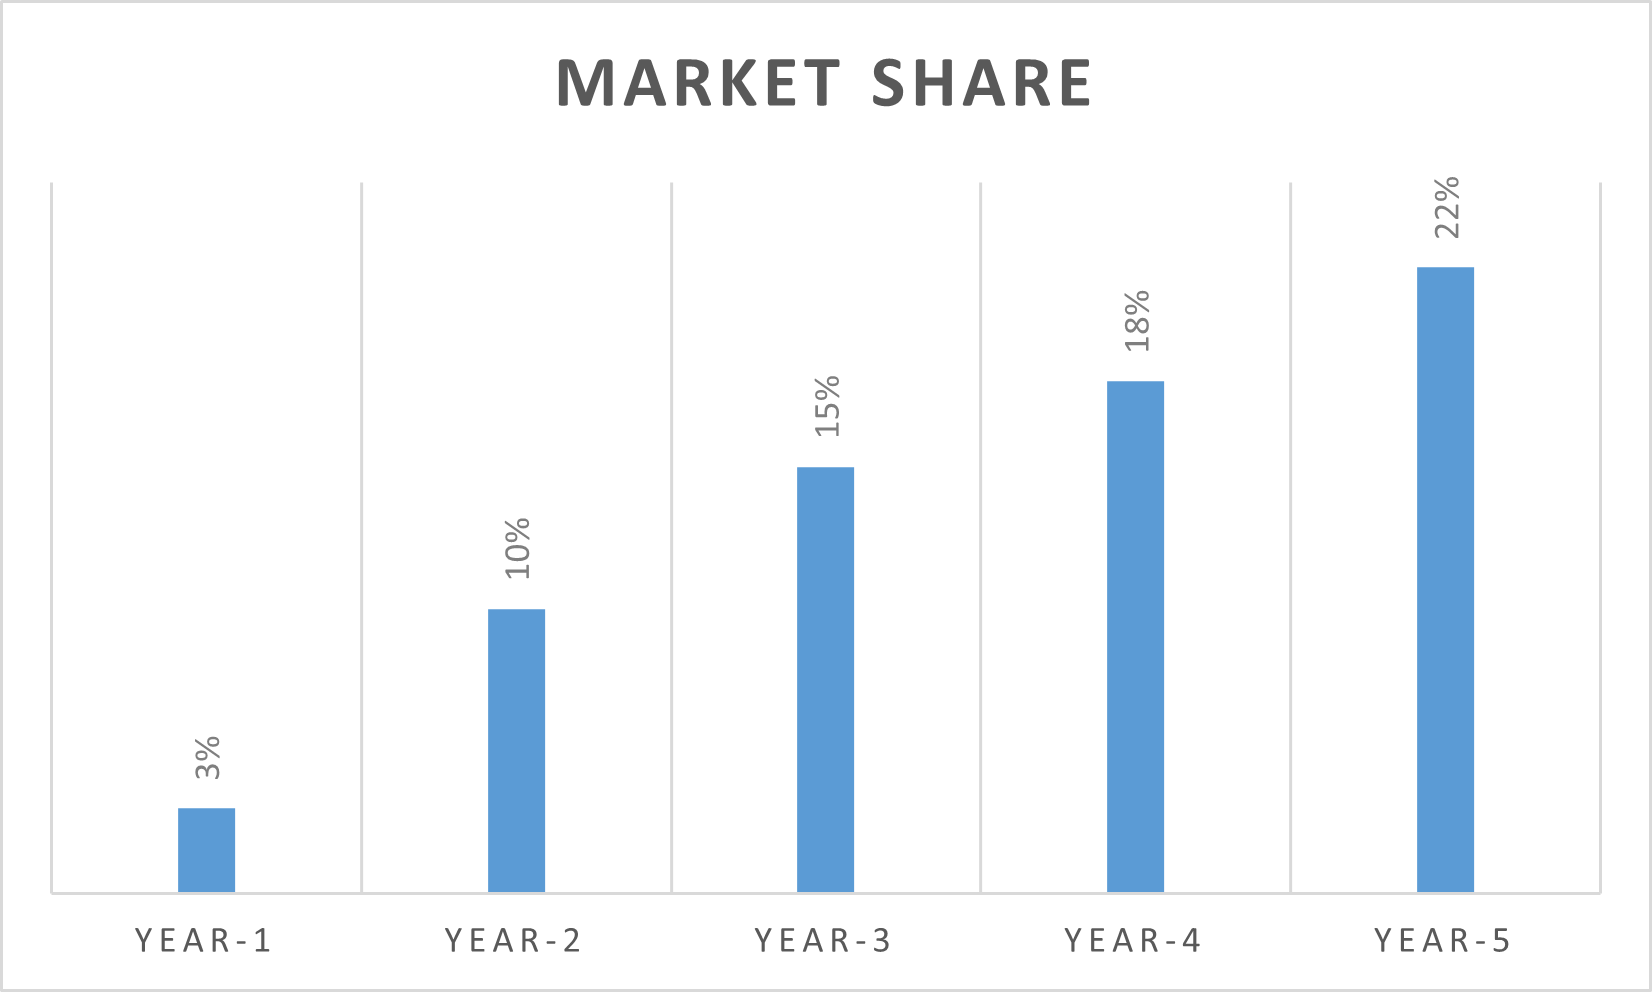
Figure 1: Market Share, Source: (Self-Made)
Figure 1 shows that over the next five years, Inniskillin Ice-wine will manage to increase its market share in Brazil. Starting from a low market share of 3% in the first year, this alcohol brand has continued strengthening its position in the market. This number increased significantly to 10% the following year, more than three times.
Although slightly slower, this growth continued and reached 15% in the third year. The fourth year’s growth was steady, and participation reached 18%. Finally, Inniskillin Ice-wine consolidated its position in its fifth year with a market share of 22%. This continued growth highlights this brand’s growing acceptance and appeal in the Brazilian wine market.
This trend of increasing market share has several important implications. Firstly, it demonstrates Inniskillin Ice-wine’s ability to reach Brazilian consumers through quality, marketing strategy, distribution channels, or a combination of these factors. Five years of steady growth means the brand is attracting and retaining customers, outperforming competitors and even converting consumers from other brands.
Secondly, growth trends, exceptionally rapid growth in the second year, suggest that the brand may have entered a previously untapped niche or taken advantage of a marketing opportunity. Growth maturity in year 5 suggests the market is saturated or the brand can reach its full potential in the current environment. For competitors and stakeholders, this means that Inniskillin Ice-wine has become a strong player in the Brazilian wine sector and needs to adjust its strategy and positioning.
Balance Sheet
The Income Statement and Cash Flows have been generated already for the next five years. Now, it is time to make a balance sheet that identifies a company’s financial position. The table below shows the balance sheet of the company;
Table 1: Balance Sheet, Source: (Self-Made)
| Year-1 | Year-2 | Year-3 | Year-4 | Year-5 | |
|---|---|---|---|---|---|
| Assets | |||||
| Cash | 40,000 | 48,000 | 57,600 | 69,120 | 82,944 |
| Account Receivable | 20,000 | 24,000 | 28,800 | 34,560 | 41,472 |
| Machinery | 1,500,000 | 1,800,000 | 2,160,000 | 2,592,000 | 3,110,400 |
| Equipment | 100,000 | 120,000 | 144,000 | 172,800 | 207,360 |
| Total Assets in $ | 1,660,000 | 1,992,000 | 2,390,400 | 2,868,480 | 3,442,176 |
| Liabilities | |||||
| Account Payable | 350,000 | 402,500 | 462,875 | 532,306.25 | 612,152.1875 |
| Loan | 350,000 | 280,000 | 224,000 | 179,200 | 143,360 |
| Other Payables | 350,000 | 420,000 | 504,000 | 604,800 | 725,760 |
| Total Liabilities | 1,050,000 | 1,102,500 | 1,190,875 | 1,316,306.25 | 1,481,272.188 |
| Equity | 610,000 | 889,500 | 1,199,525 | 1,552,174 | 1,960,904 |
| Total Liabilities & Equity | 1,660,000 | 1,992,000 | 2,390,400 | 2,868,480 | 3,442,176 |
The company’s financial trajectory, described in terms of total assets, shows robust financial health and continued growth over time. Starting with assets worth $1,660,000, this amount gradually increased to $3,442,176 by the end of the fifth year.
A gain of nearly 108% over five years indicates significant capital accumulation, effective asset management, or both. This trend means that the company has effectively reinvested profits, expanded operations, or diversified investments. For stakeholders, this is a sign that the company is not only growing but is also likely to strengthen its position in the industry, demonstrating sound financial management and broad potential.
Financial Analysis
Both income statement and balance sheet have been used to analyze the potential of entering the Brazilian Market. The focus of this analysis is of two folds, such as profitability analysis and efficiency analysis that involve both the forecasted income statement and balance sheet made earlier.
Profitability Analysis
The two ratios that have been utilized here are Operating Profit Margin (OPM) and Net Profit Margin (NPM) (Easton et al., 2021). These profitability margins enable a company to generate operating and net profit. The table and chart for Inniskillin Ice-wine’s profitability are as follows;
Table 2: Profitability Analysis, Source: (Self-Made)
| Year-1 | Year-2 | Year-3 | Year-4 | Year-5 | |
|---|---|---|---|---|---|
| OPM in % | 35 | 34.1 | 35.76 | 36 | 36.2 |
| NPM in % | 18.4 | 18.5 | 18.9 | 19.5 | 19.7 |
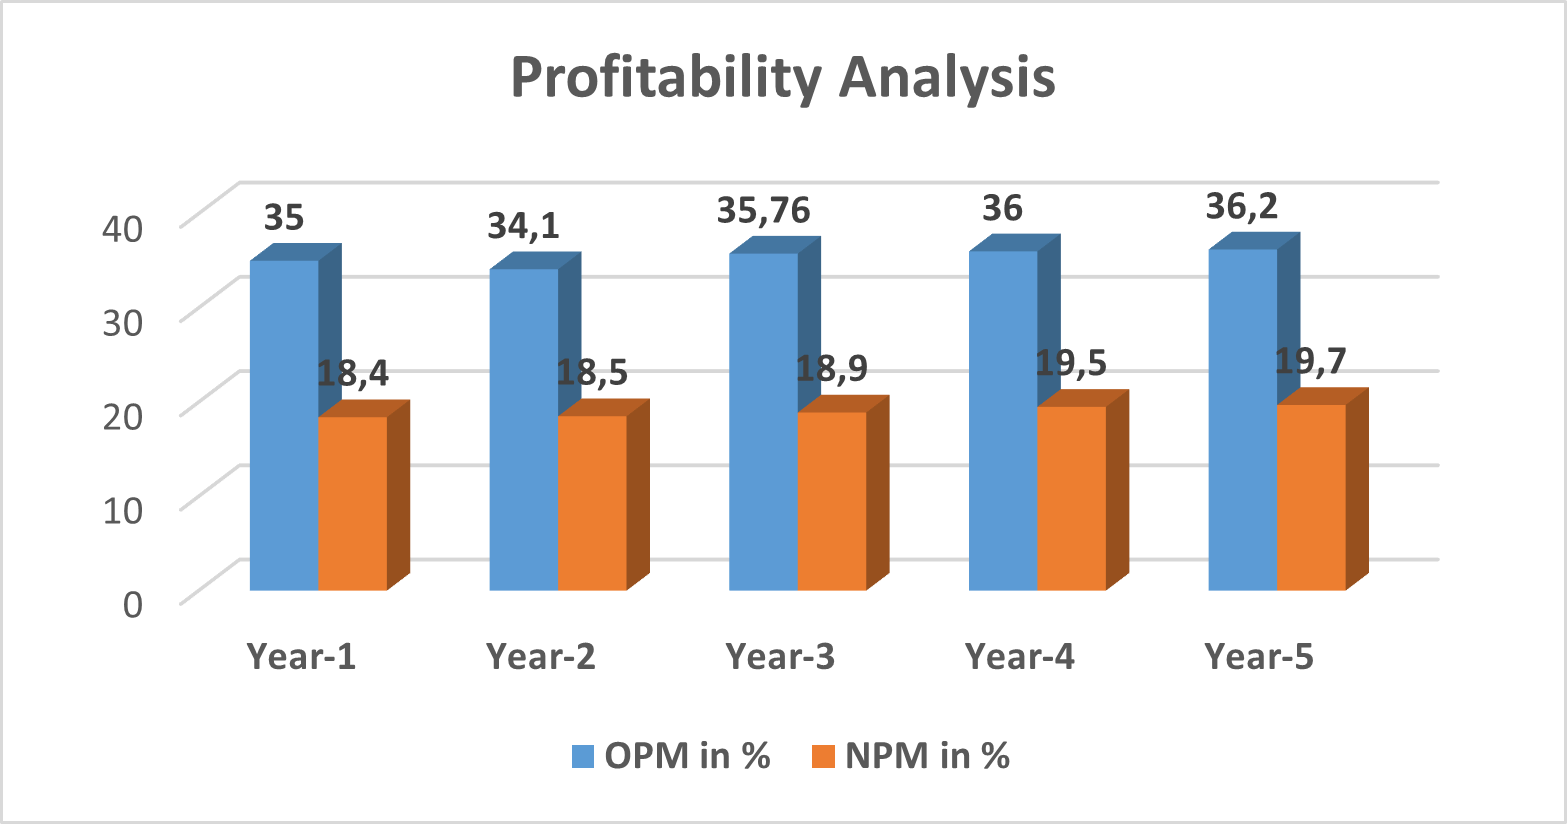
Figure 2: Profitability Analysis, Source: (Self-Made)
Operating profit margin (OPM) and net profit margin (NPM) are important indicators that reflect a company’s profitability compared to sales. The average OPM of Inniskillin Ice-wine while entering the Brazilian market will be 35.41% on average, which means that more than 1/3 of sales are maintained as operating profit considering variable costs.
The NPM, on the other hand, will be 19%, meaning that almost a fifth of every dollar of revenue becomes net profit after all costs, including taxes and interest. These figures show that the company has adequate operational controls and good operational performance in Brazil. A large gap between OPM and NPM can indicate significant financial costs or tax implications that companies must consider to maximize profits.
Efficiency Analysis
The two effective ratios here are Return on Assets (ROA) and Return on Equity (ROE). It evaluates the efficiency of the assets and equity of a company in generating profit (Easton et al., 2021). The table and chart show the exact details of Inniskillin Ice-wine.
Table 3: Efficiency Analysis, Source: (Self-Made)
| Year-1 | Year-2 | Year-3 | Year-4 | Year-5 | |
|---|---|---|---|---|---|
| ROA in % | 20.75 | 28.88 | 39.25 | 42.39 | 42.39 |
| ROE in % | 56.47 | 64.67 | 78.21 | 78.33 | 74.40 |
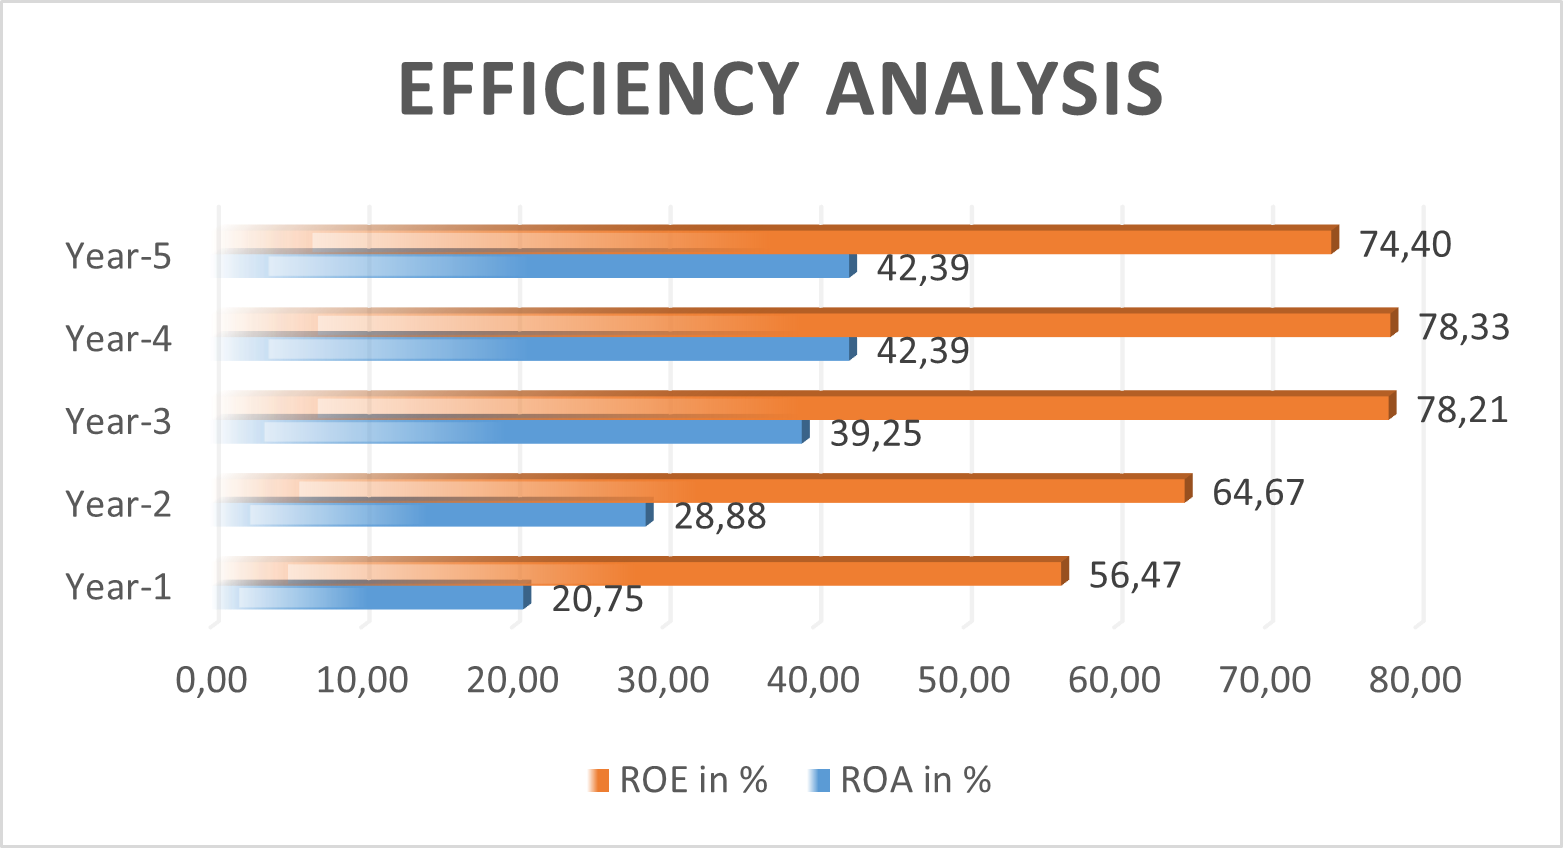
Figure 3: Efficiency Analysis, Source: (Self-Made)
Financial performance indicators of companies in the Brazilian market, especially return on assets (ROA) and return on equity (ROE), provide a detailed picture of efficiency and their profits. ROA is 34.72%, meaning that every dollar invested in the asset will generate a profit of approximately $0.3472, highlighting the efficient use of assets.
Meanwhile, a whopping ROE of 70.41% means the company returned $0.7041 for every $1 of equity, which speaks volumes about its ability to leverage its capital base. Especially when viewed together, these numbers show that the company is adept at leveraging its assets and efficient at generating solid returns for shareholders. These indicators show this is a potentially attractive proposition for investors and companies operating and financially performing in the Brazilian market.
References
Easton, P. D., McAnally, M. L., Sommers, G. A., & Zhang, X. J. (2021). Financial statement analysis & valuation. Cambridge Business Publishers.
